
Reynolds Number Effect on Transonic Aerodynamic Characteristics of Slender Body
JAXA Supercomputer System Annual Report April 2020-March 2021
Report Number: R20EACA21
Subject Category: JSS Inter-University Research
- Responsible Representative: Keiichi Kitamura, Associate Professor, Yokohama National University
- Contact Information: Hayato Kawashima (Yokohama National University)(kawashima-hayato-rn@ynu.jp)
- Members: Keiichi Kitamura, Hayato Kawashima
Abstract
In order to obtain the drag value of a slender body such as rockets from a wind tunnel test, the drag correction considering cavity pressure and base pressure is typically required to remove the effect of a sting. At first in this study, the correcting method have been investigated by using the CFD results which successfully reproduced the wind tunnel test of a slender body. In addition, to obtain more practical slender body aerodynamic characteristics, the body size of the computational object was extended from the experimental scale (Re ≃ 10⁶) to the actual flight scale (Re ≃ 10⁸). Then, the difference in aerodynamic characteristics between the wind test scale and the actual flight scale is evaluated, and it contributes to the aerodynamic design of the actual space transport aircraft.
Reference URL
N/A
Reasons and benefits of using JAXA Supercomputer System
In this research, there were many calculation cases because we handled various shapes and angles of attack, and the number of grid points was very large because we required high-resolution results. For this reason, we needed to use the supercomputer.
Achievements of the Year
First, regarding the cavity pressure correction, the cavity pressure was assumed to be the same as the uniform flow static pressure, and the forebody drag coefficient obtained from each of the wind tunnel test and CFD were compared. As a result, the accuracy was within 1 %. On the other hand, when the cavity pressure is assumed to be vacuum, this error is found to be as large as about 13 %. Thus, it was found that it is appropriate to assume that the cavity pressure is equivalent to the uniform flow static pressure even under the condition that a shock wave exists around the body. Regarding the base pressure correction, it was found that the error can be minimized by avoiding the local high pressure region (Figure 1) that appears on the upwind and leeward side. Figure 2 shows the results (drag coefficient) of the actual flight Reynolds number calculation at Mach 0.9 and an angle of attack of 0 degree. For comparison, the results of the wind tunnel test Reynolds number calculation are also shown here. From this result, it is found that the viscous friction component of the forebody drag is 23 to 30% smaller in the case of the actual Reynolds number. However, since this value accounts for a small proportion of the total drag, it does not significantly affect the total drag. As a result, it is found that the error between the calculation of the actual flight Reynolds number and the wind test Reynolds number was relatively small (6 %).
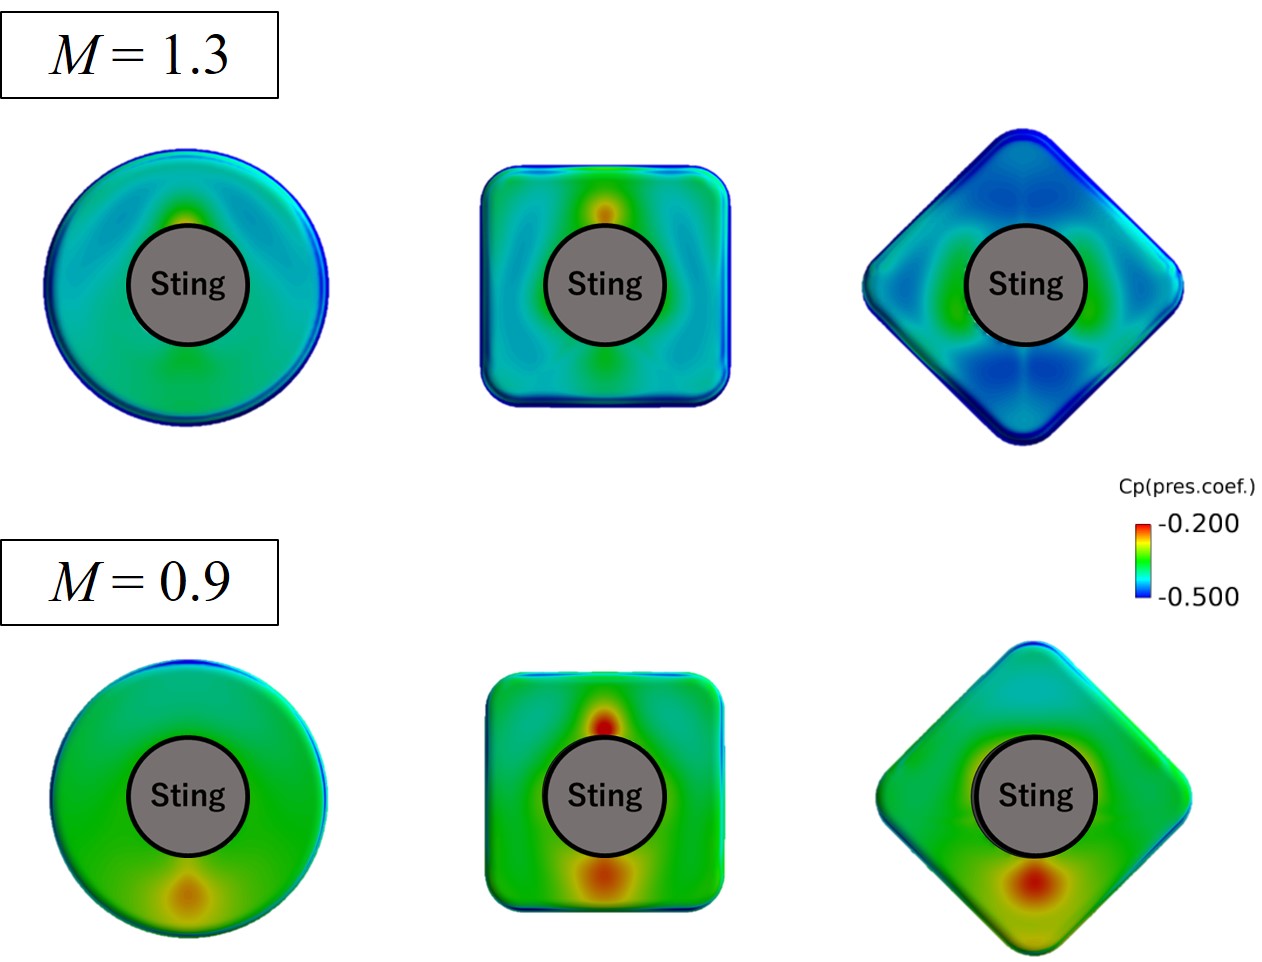
Fig.1: Base pressure distribution of various shapes
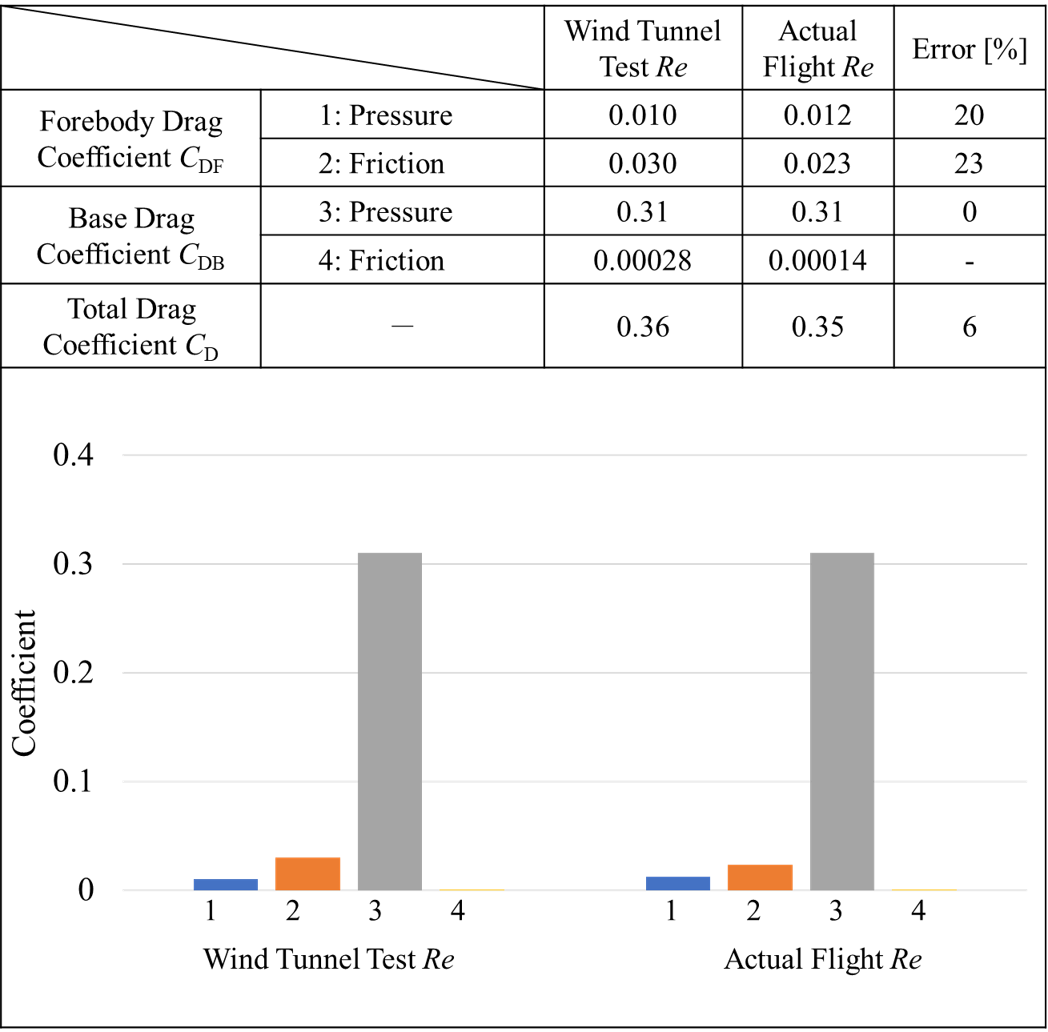
Fig.2: Reynolds number effect (M = 0.9, AoA = 0 deg.)
Publications
- Oral Presentations
1) Hayato Kawashima, Keiichi Kitamura, Satoshi Nonaka, "Drag Correction using Transonic Wind Tunnel Test and CFD Result -Effect of Base Pressure Mesurement Position-", Dynamics Symposium of Space Navigation, Japan (Online), December, 2020.
Usage of JSS
Computational Information
- Process Parallelization Methods: MPI
- Thread Parallelization Methods: N/A
- Number of Processes: 96 - 512
- Elapsed Time per Case: 10 Hour(s)
Resources Used(JSS2)
Fraction of Usage in Total Resources*1(%): 0.15
Details
Please refer to System Configuration of JSS2 for the system configuration and major specifications of JSS2.
| System Name | Amount of Core Time(core x hours) | Fraction of Usage*2(%) |
|---|---|---|
| SORA-MA | 685,553.65 | 0.13 |
| SORA-PP | 21,395.62 | 0.17 |
| SORA-LM | 1,585.70 | 0.93 |
| SORA-TPP | 0.00 | 0.00 |
| File System Name | Storage Assigned(GiB) | Fraction of Usage*2(%) |
|---|---|---|
| /home | 6.68 | 0.01 |
| /data | 4,787.45 | 0.09 |
| /ltmp | 1,367.19 | 0.12 |
| Archiver Name | Storage Used(TiB) | Fraction of Usage*2(%) |
|---|---|---|
| J-SPACE | 0.00 | 0.00 |
*1: Fraction of Usage in Total Resources: Weighted average of three resource types (Computing, File System, and Archiver).
*2: Fraction of Usage:Percentage of usage relative to each resource used in one year.
Resources Used(JSS3)
Fraction of Usage in Total Resources*1(%): 0.01
Details
Please refer to System Configuration of JSS3 for the system configuration and major specifications of JSS3.
| System Name | Amount of Core Time(core x hours) | Fraction of Usage*2(%) |
|---|---|---|
| TOKI-SORA | 0.00 | 0.00 |
| TOKI-RURI | 4.91 | 0.00 |
| TOKI-TRURI | 0.00 | 0.00 |
| File System Name | Storage Assigned(GiB) | Fraction of Usage*2(%) |
|---|---|---|
| /home | 478.74 | 0.33 |
| /data | 9,784.70 | 0.16 |
| /ssd | 114.44 | 0.06 |
| Archiver Name | Storage Used(TiB) | Fraction of Usage*2(%) |
|---|---|---|
| J-SPACE | 0.00 | 0.00 |
*1: Fraction of Usage in Total Resources: Weighted average of three resource types (Computing, File System, and Archiver).
*2: Fraction of Usage:Percentage of usage relative to each resource used in one year.
JAXA Supercomputer System Annual Report April 2020-March 2021