
Retrieval of greenhouse gas concentrations from GOSAT-2 observations
JAXA Supercomputer System Annual Report February 2021-January 2022
Report Number: R21ER3501
Subject Category: Space Technology
- Responsible Representative: KUZE Akihiko, GOSAT-2 Project Team, Space Technology Directorate I
- Contact Information: Nobuhiro Kikuchi (Earth Observation Research Center)(kikuchi.nobuhiro@jaxa.jp)
- Members: Makiko Hashimoto, Shin Ishida, Kenji Kowata, Fumie Kataoka, Nobuhiro Kikuchi, Shigeaki Wada, Tomoo Yamasaki, Takehito Yoshida
Abstract
Atmospheric concentrations of carbon dioxide, methane and carbon monoxide are retrieved from hyper sectral data measured by The Greenhouse Gasea Observing Sattelite 2 (GOSAT-2). Develepment, validation and imprivement of the retrieva algorithm are also carried out.
Reference URL
N/A
Reasons and benefits of using JAXA Supercomputer System
The JAXA supercomputer system is used to retrieved greenhouse gas concentrations from measurement data of the GOSAT-2 satellite. About 100 hours of CPU time is needed to process 1day mesurement data. It takes about 1 hour to process 1 day measurement data, using 10 nodes of the PrePost system computers with 12 cores.
Achievements of the Year
We are developing the JAXA/EORC research algorithm (Level 2 algorithm) for GOSAT-2 which derives from the Level 1 data the atmospheric concentrations of carbon dioxide, methane and carbon monoxide. The simultaneous use of both shortwave infrared (SWIR) and thermal infrared (TIR) spectra is one the characteristics of our algorithm, which enables us to retrieve not only the column averaged concentrations, but also the vertical profiles with up to two layers in the troposphere for carbon dioxide and methane. We also utilize the polarization information in the SWIR explicitly to correct the undesirable effects of aerosols. Our goal is to improve the estimate of the emission/absorbing fluxes of greenhouse gases by fully utilizing the GOSAT-2 measurements.
In this year we retrieved the greenhouse gas concentrations using the version 200200 of the Level 1 product of GOSAT-2 which was released in 2021.
We first verified the accuracy of the column averaged concentrations of carbon dioxide and methane by comparing with the TCCON (Total Carbon Column Observing Network) data. Figure 1 (left) is the result of the validation of the column averaged concentration of carbon dioxide (XCO2). We selected 14 TCCON sites for which there are at least 10 matches up data with the GOSAT-2 observations. The bias of the XCO2 is 0.0 ppm in total, with the standard deviation of 2.7 ppm. The mean bias over the 14 TCCON sites was 0.7 ppm, with the standard deviation of 2.0 ppm. These values are about 1 ppm larger than those for GOSAT-1. We consider that the GOSAT-2 retrieval for XCO2 is accurate but can be improved further. Similarly, figure 1 (right) shows the validation of the column averaged of concentrations of methane (XCH4).
Figure 2 shows the monthly mean of the XCO2 in July 2021 (left) together with the lower tropospheric concentrations of carbon dioxide (right). We consider that the global distribution of the retrieved XCO2 is reasonable, but the lower tropospheric concentrations are too high over the ocean in the Southern Hemisphere. On the other hand, figure 3 shows that both the XCH4 and the lower tropospheric methane concentrations are retrieved successfully. The investigation is underway to improve both the Level 1 product and the Level 2 algorithm.
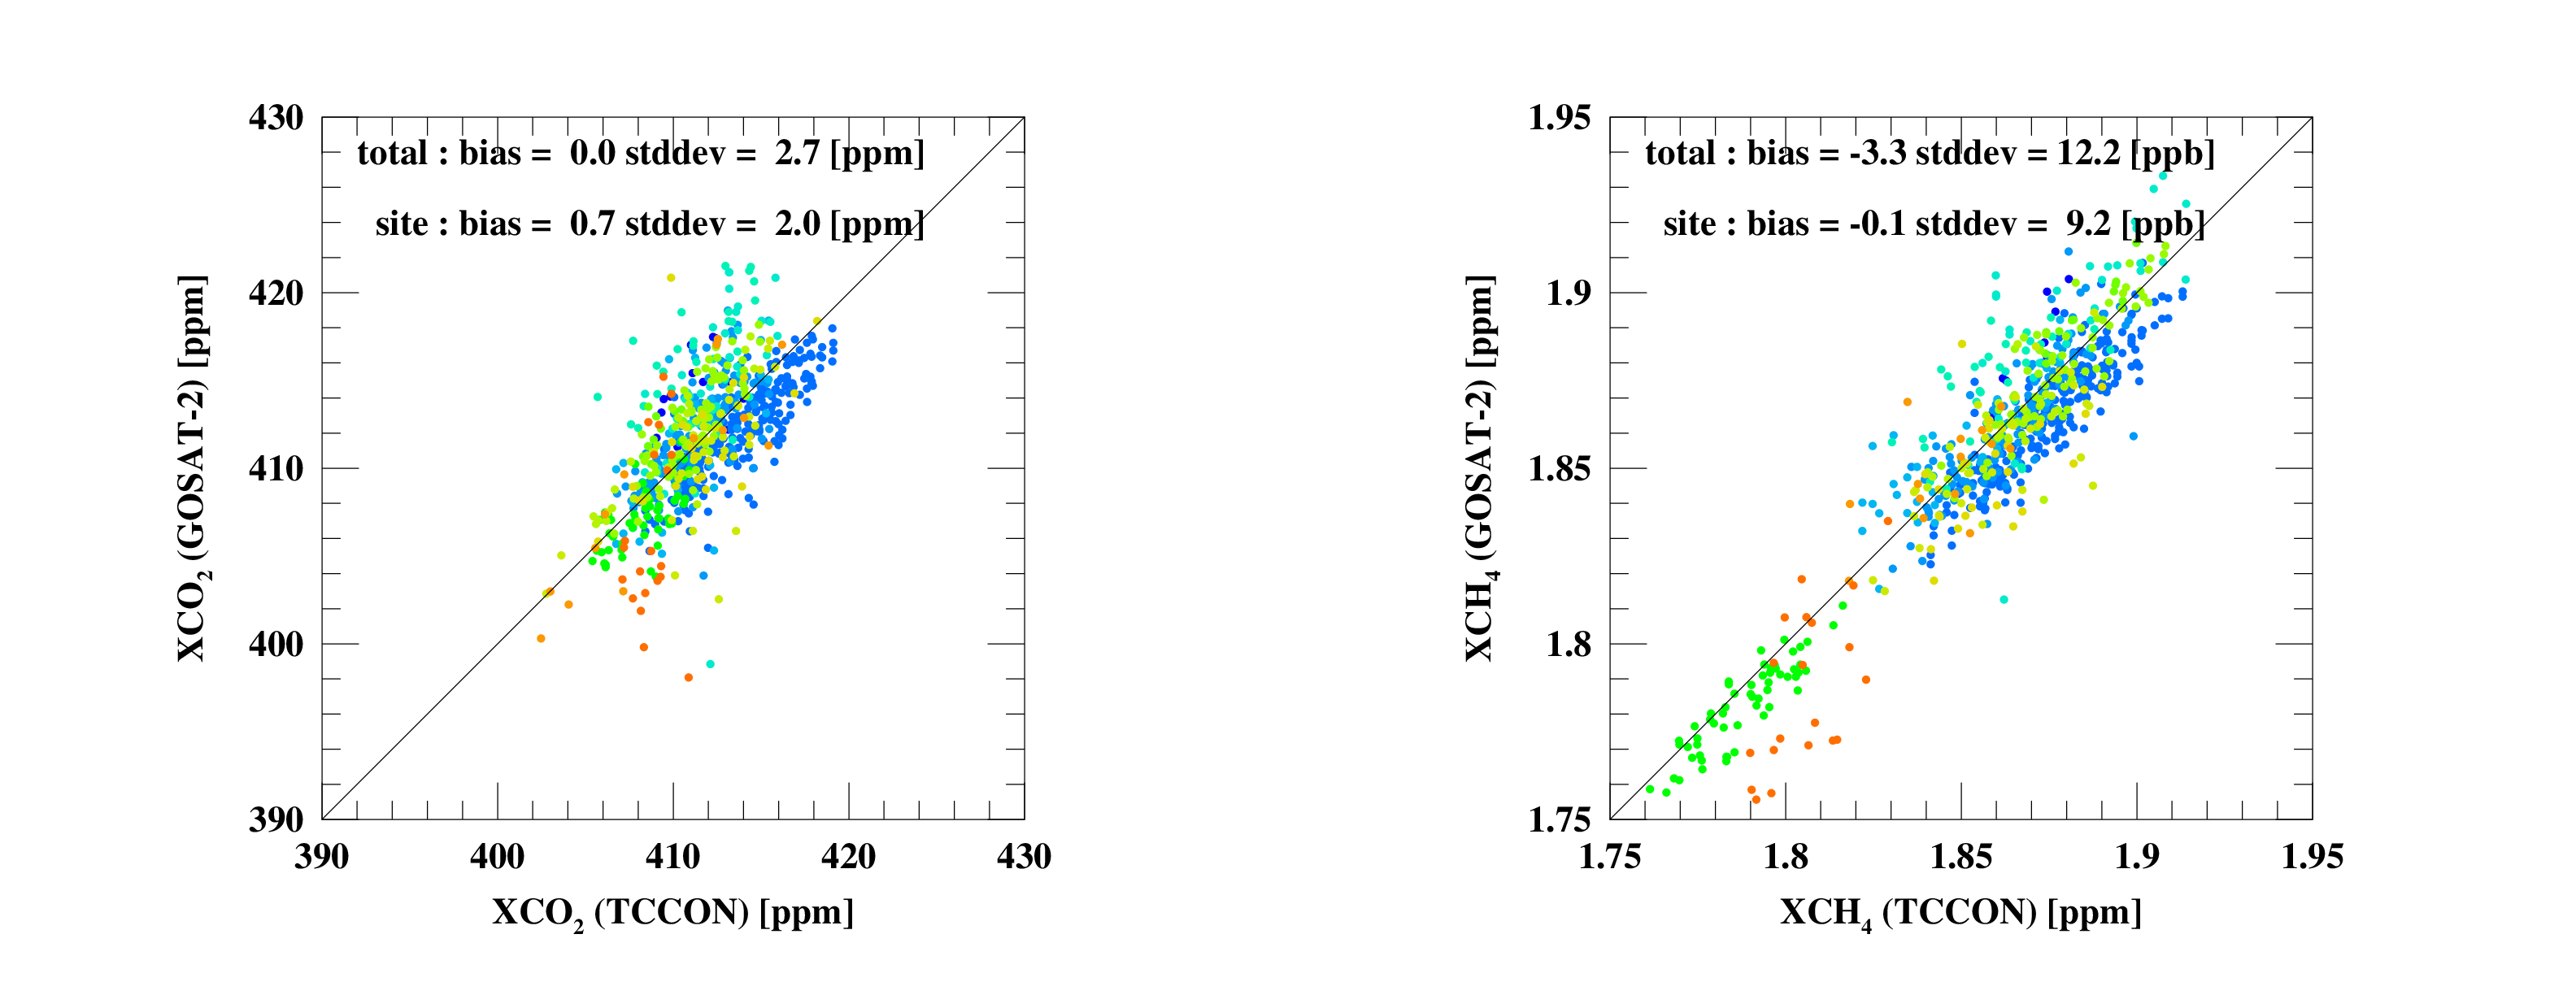
Fig.1: (left) Comparison of the column averaged concentrations of carbon dioxide retrieved from GOSAT-2 observations with TCCON data. (right) Similar to left, but for the column averaged concentrations of methane.
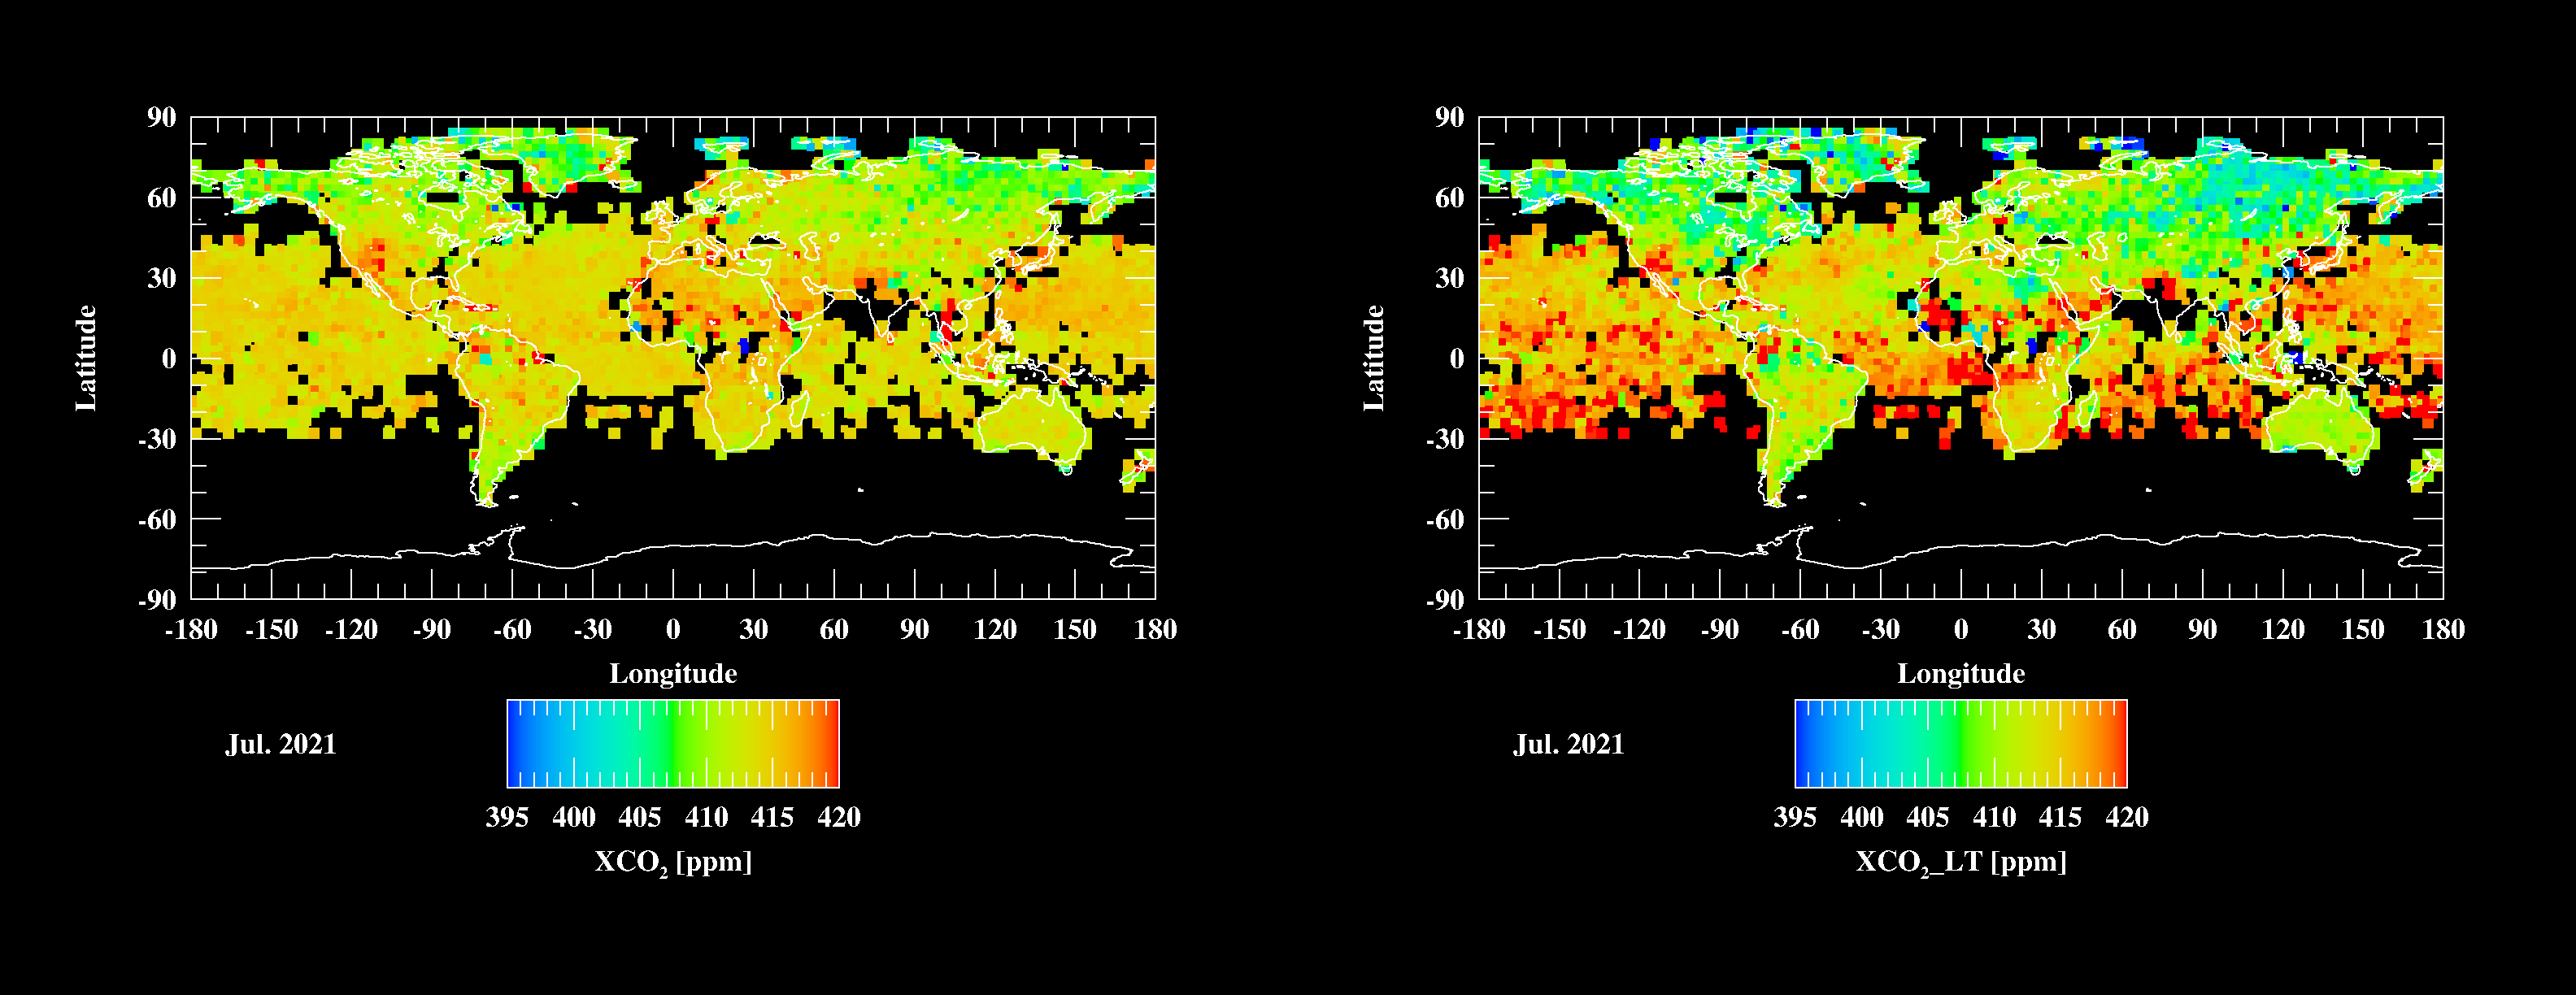
Fig.2: (left) Monthly mean of the column averaged concentrations of carbon dioxide in July 2021 retrieved from GOSAT-2 observations. (right) Similar to left, but for the lower tropospheric concentrations of carbon dioxide.
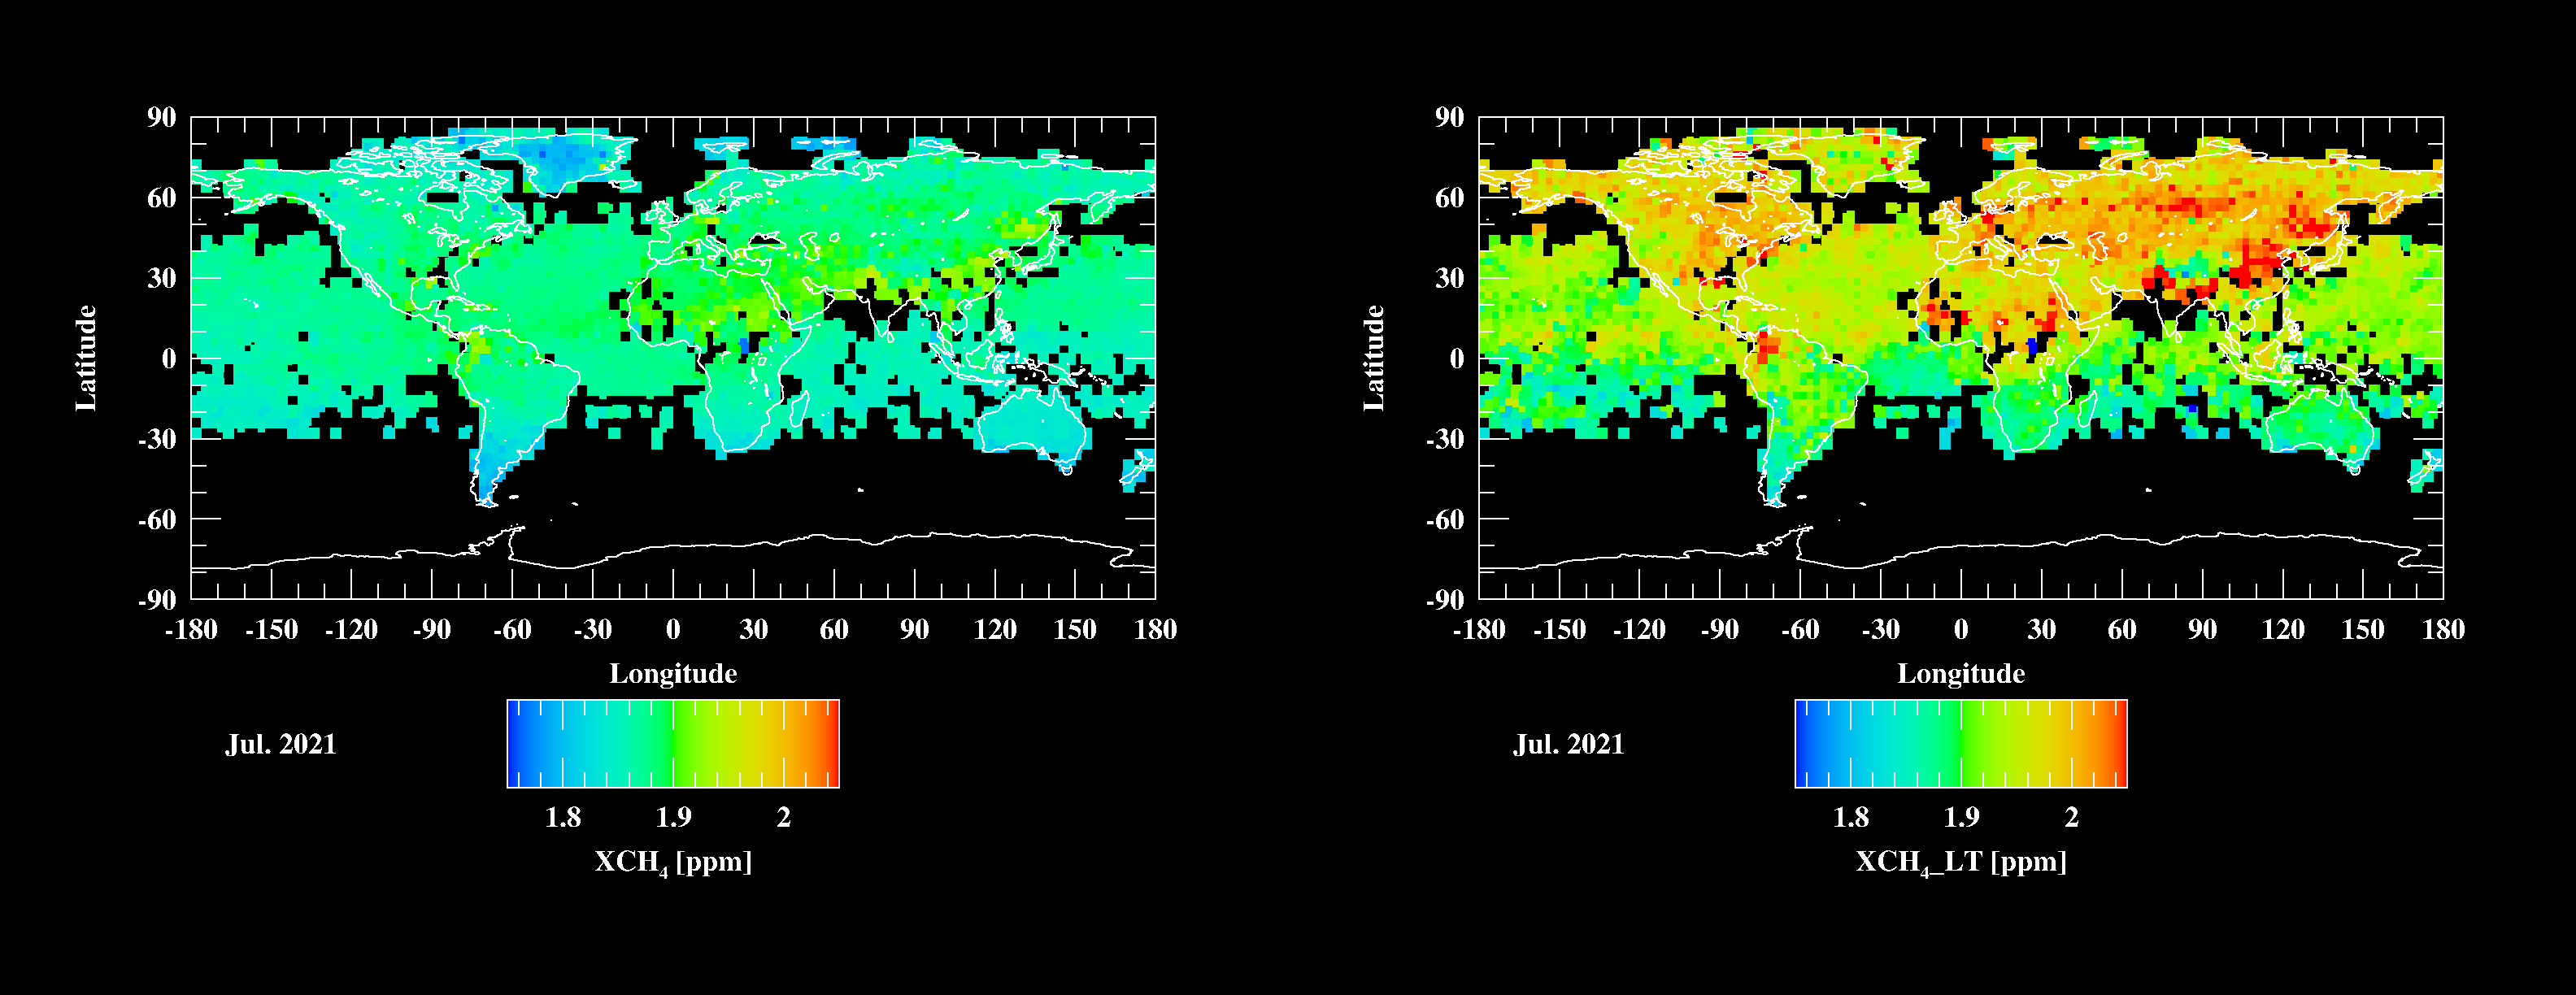
Fig.3: (left) Monthly mean of the column averaged concentrations of methane in July 2021 retrieved from GOSAT-2 observations. (right) Similar to left, but for the lower tropospheric concentrations of methane.
Publications
N/A
Usage of JSS
Computational Information
- Process Parallelization Methods: N/A
- Thread Parallelization Methods: OpenMP
- Number of Processes: 1
- Elapsed Time per Case: 10 Hour(s)
JSS3 Resources Used
Fraction of Usage in Total Resources*1(%): 0.05
Details
Please refer to System Configuration of JSS3 for the system configuration and major specifications of JSS3.
| System Name | CPU Resources Used(Core x Hours) | Fraction of Usage*2(%) |
|---|---|---|
| TOKI-SORA | 0.00 | 0.00 |
| TOKI-ST | 325090.90 | 0.40 |
| TOKI-GP | 0.00 | 0.00 |
| TOKI-XM | 0.00 | 0.00 |
| TOKI-LM | 0.18 | 0.00 |
| TOKI-TST | 0.00 | 0.00 |
| TOKI-TGP | 0.00 | 0.00 |
| TOKI-TLM | 0.00 | 0.00 |
| File System Name | Storage Assigned(GiB) | Fraction of Usage*2(%) |
|---|---|---|
| /home | 32.10 | 0.03 |
| /data and /data2 | 102720.95 | 1.10 |
| /ssd | 320.95 | 0.08 |
| Archiver Name | Storage Used(TiB) | Fraction of Usage*2(%) |
|---|---|---|
| J-SPACE | 170.43 | 1.15 |
*1: Fraction of Usage in Total Resources: Weighted average of three resource types (Computing, File System, and Archiver).
*2: Fraction of Usage:Percentage of usage relative to each resource used in one year.
ISV Software Licenses Used
| ISV Software Licenses Used(Hours) | Fraction of Usage*2(%) | |
|---|---|---|
| ISV Software Licenses(Total) | 0.00 | 0.00 |
*2: Fraction of Usage:Percentage of usage relative to each resource used in one year.
JAXA Supercomputer System Annual Report February 2021-January 2022