
Numerical Study on Rotor Performance of Mars Helicopter
JAXA Supercomputer System Annual Report April 2020-March 2021
Report Number: R20EACA41
Subject Category: JSS Inter-University Research
- Responsible Representative: Makoto Sato, Associate Professor, Kogakuin University
- Contact Information: Makoto Sato, Kogakuin University(msato@cc.kogakuin.ac.jp)
- Members: Makoto Sato, Daichi Ogasawara
Abstract
Mars helicopter project is now going. Since the atomospheric density on Mars is about 1/100, the sound of speed is about 3/4 compared with those on Earth, we need to develop the high perfmance heli-rotar. In JAXA, the experimental measurements of the heli-rotar performance at low-Reynolds number condition have been conducted. In the present research, we conduct numerical simulations on the rotational flat-plate-airfoil flow in order to clarify the characteristics of the flow field.
Reference URL
N/A
Reasons and benefits of using JAXA Supercomputer System
We need to conduct the large-scale simulations on the rotational wing flow using "rFlow3D", which has been developed in JAXA.
Achievements of the Year
We have conducted the numerical simulations on rotational tirangular-airfoil flows. The computational objects and conditions are decided based on the experiments at ISAS [1]. The computational parameters are the Reynolds number(3000-20000), pitch angle(0-30). Here, the results of "thick triangluar airfoil" are shown. The flow solver is rFLow3D, which has been developed at JAXA.
Figure 1 shows effects of the Reynolds number on Ct(thrust coefficient)-Cq(torque coefficient). For the cases with higher Reynolds numbers (15000 < Re), the Reynolds number effects on Ct and Cq are weak. On the other hand, for the cases with lower Reynolds numbers (Re < 15000), the aerodynamic performances change with the decreasing of the Reynolds number. While Ct and Cq increase in the region shown by the red frame, Ct and Cq decrease in the blue frame.
Figures 2 and 3 depict the flow vectors colord with Cp at a cross section (r/R=0.75) for each Reynolds number case. Figure 2 shows the cases with the pitch angle 5 deg. and Fig. 3 shows those with the pitch angle 15 deg. From Fig.2, lower Cp at the upper surface and higher Cp at lower surface can be observed with the decreases of the Reynolds number. In addition, from Fig. 3, the Cp at the leading edge increases with the decreases of the Reynolds number, becase of the length of the separation bubble.
Figure 4 shows the Cp distributions for each Reynolds number case. For Re < 10000, the pressure recovery becomes moderate. On the other hand, for Re > 10000, the pressure flat region and rapid recovery can be observed. These pressure distributions are closely similar to the results by the LES on fixed airfoil flows at low-Reynolds numbers [2].
[1] Koh, M. "Evaluation of Aerodynamic Performances of Single Rotor and Counter-rotating Rotor with Triangular Airfoil in Low Reynolds Number Conditions", Master Thesis of University of Tokyo, (2020).
[2] Lee, D. "A Study on Formation Mechanisms of Surface Pressure Distribution around a Laminar Separation Bubble", Doctoral Thesis of University of Tokyo, (2017).
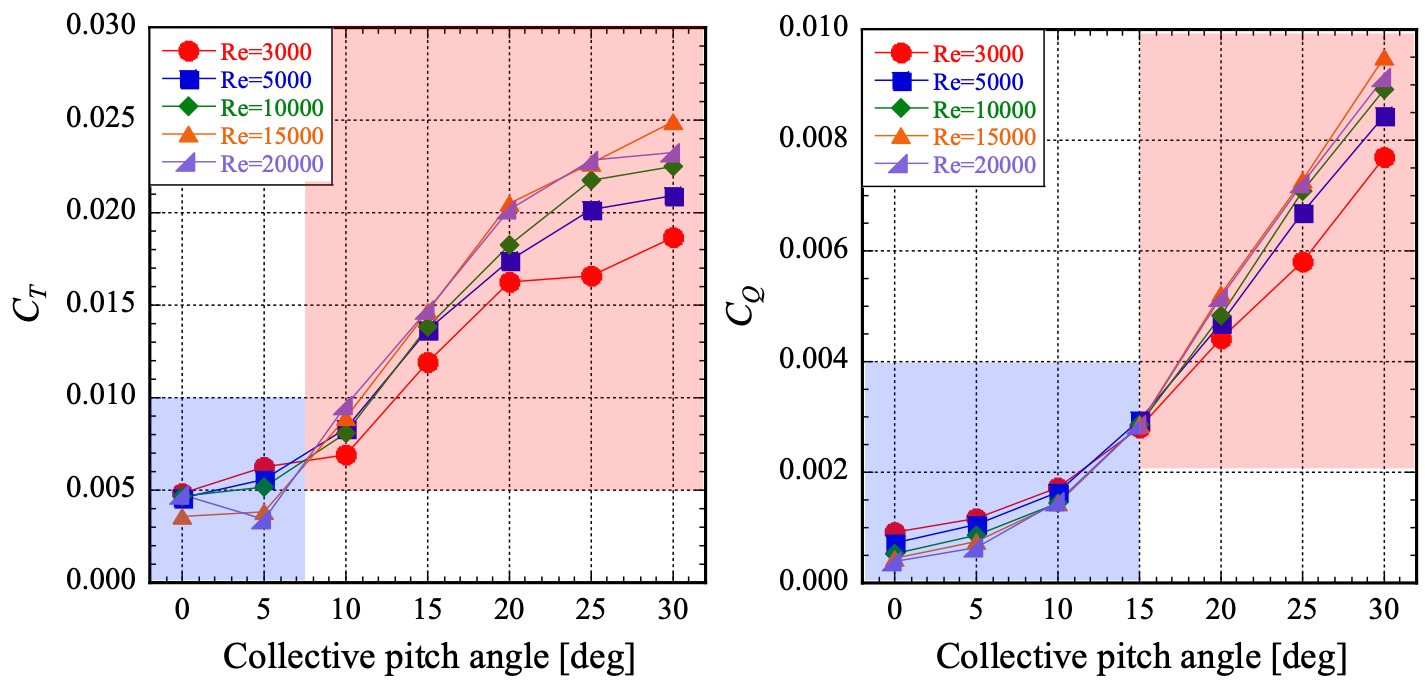
Fig.1: Aerodynamic performances of triangular arifoil at low Reynolds numbers
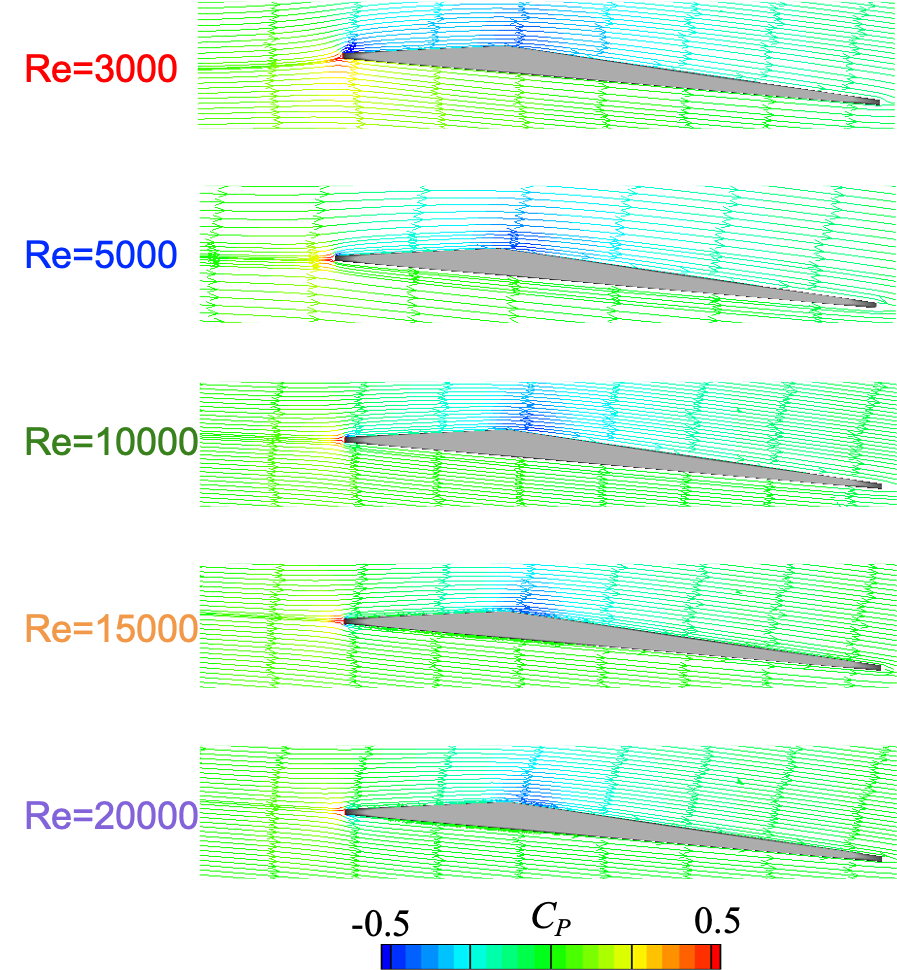
Fig.2: Cross sectional (r/R=0.75) pressure distributions for pitch angle 5 deg.
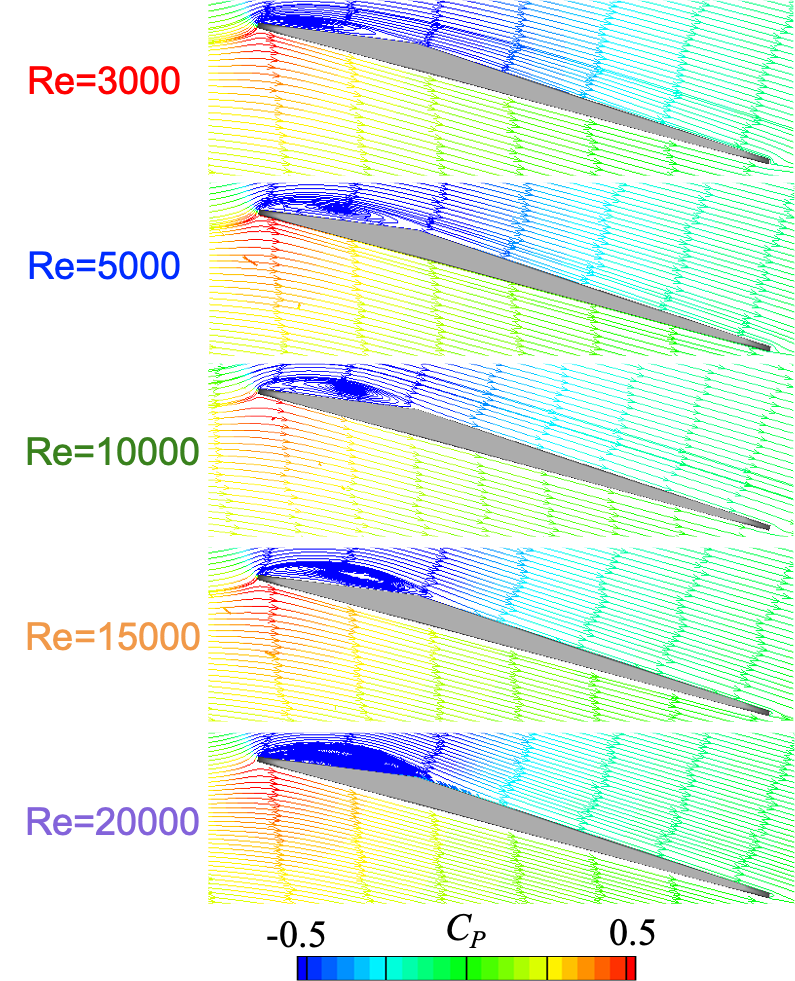
Fig.3: Cross sectional (r/R=0.75) pressure distributions for pitch angle 15 deg.
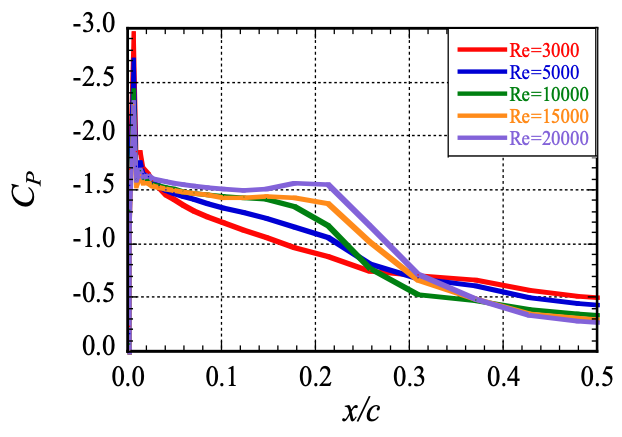
Fig.4: Surface pressure distributions
Publications
N/A
Usage of JSS
Computational Information
- Process Parallelization Methods: N/A
- Thread Parallelization Methods: OpenMP
- Number of Processes: 1
- Elapsed Time per Case: 400 Hour(s)
Resources Used(JSS2)
Fraction of Usage in Total Resources*1(%): 0.18
Details
Please refer to System Configuration of JSS2 for the system configuration and major specifications of JSS2.
| System Name | Amount of Core Time(core x hours) | Fraction of Usage*2(%) |
|---|---|---|
| SORA-MA | 0.00 | 0.00 |
| SORA-PP | 303,086.83 | 2.38 |
| SORA-LM | 0.00 | 0.00 |
| SORA-TPP | 0.00 | 0.00 |
| File System Name | Storage Assigned(GiB) | Fraction of Usage*2(%) |
|---|---|---|
| /home | 19.07 | 0.02 |
| /data | 19,531.26 | 0.38 |
| /ltmp | 3,906.25 | 0.33 |
| Archiver Name | Storage Used(TiB) | Fraction of Usage*2(%) |
|---|---|---|
| J-SPACE | 0.00 | 0.00 |
*1: Fraction of Usage in Total Resources: Weighted average of three resource types (Computing, File System, and Archiver).
*2: Fraction of Usage:Percentage of usage relative to each resource used in one year.
Resources Used(JSS3)
Fraction of Usage in Total Resources*1(%): 0.11
Details
Please refer to System Configuration of JSS3 for the system configuration and major specifications of JSS3.
| System Name | Amount of Core Time(core x hours) | Fraction of Usage*2(%) |
|---|---|---|
| TOKI-SORA | 533,196.81 | 0.11 |
| TOKI-RURI | 3,675.99 | 0.02 |
| TOKI-TRURI | 0.00 | 0.00 |
| File System Name | Storage Assigned(GiB) | Fraction of Usage*2(%) |
|---|---|---|
| /home | 9.54 | 0.01 |
| /data | 9,765.63 | 0.16 |
| /ssd | 95.37 | 0.05 |
| Archiver Name | Storage Used(TiB) | Fraction of Usage*2(%) |
|---|---|---|
| J-SPACE | 0.00 | 0.00 |
*1: Fraction of Usage in Total Resources: Weighted average of three resource types (Computing, File System, and Archiver).
*2: Fraction of Usage:Percentage of usage relative to each resource used in one year.
JAXA Supercomputer System Annual Report April 2020-March 2021