
Atmospheric Environmental Monitoring Simulation
JAXA Supercomputer System Annual Report April 2020-March 2021
Report Number: R20ER2401
Subject Category: Space Technology
- Responsible Representative: Hiroshi Murakami, Reaserch area leader, JAXA Earth Observation Research Center
- Contact Information: Hiroshi Murakami(murakami.hiroshi.eo@jaxa.jp)
- Members: Daisuke Goto, Hiroshi Murakami, Makiko Hashimoto, Tie Dai, Yueming Cheng
Abstract
This project is aimed at development of an integrated system of numerical modeling and satellite observation of air pollution for its reliable monitoring and prediction. Specially, an atmospheric air pollution transport model (NICAM-Chem) with a data assimilation technique using atmospheric aerosol products retrieved from GCOM-C/SGLI is developed as a prototype for the next generation forecast system in NIES, named VENUS. As a result, the system can reproduce much realistic air pollutions than ever before.
Reference URL
Please refer to 'Atmosphere | Earth observation research | JAXA Earth Observation Research Center (EORC)'.
Reasons and benefits of using JAXA Supercomputer System
In the project, we need to conduct numerical simulations and assimilations with higher spatial grid spacings over wide area for reliable monitoring and predictions of air pollutions over the region. This requires us to exploit high performance super computing resources of JAXA Supercomputer System (JSS) available at JAXA.
Achievements of the Year
We simulated aerosols in a global scale using an air pollution model (NICAM-Chem). In particular, we focused on a remarkable dust event over East Asia at the end of March 2018. The horizontal resolution of NICAM-Chem is set at 56 km, which is the highest resolution among the assimilated simulations. The assimilation technique is a Localized Ensemble Transform Kalman Filter (LETKF) for aerosol simulation. Two numerical experiments with and without assimilation using aerosol optical thickness (AOT) retrieved from GCOM-C/SGLI were conducted. Last year the GCOM-C/SGLI AOT in version 1 was used, but this year the version 2 is used.
Figure 1 shows the horizontal distribution of both simulated and assimilated AOT on 9-days mean from 23 March 2018 to 31 March 2018. This shows that the assimilation increases dust AOT in Mongolia and northeastern China. The AOT reductions are found in southern and central China caused by reductions in anthropogenic matters of sulfate and carbonaceous aerosols. Further validation of NICAM-Chem assimilation results is performed using independent observations from the assimilation. Figure 2 shows a comparison of the 3-dimensional distribution of aerosol extinction at three sites (Ulaanbaatar near the dust source and Fukuoka and Osaka over the outflow areas) in the Asian dust and aerosol lidar observation network (AD-Net). As a result, the assimilated aerosols in Ulaanbaatar are closer to the observations, especially on 29-30 March, by reducing the overestimation of the simulated aerosols. The aerosols found in Ulaanbaatar in assimilation and observation on the day are found at Fukuoka and Osaka on 30-31 March. In contrast, in Fukuoka and Osaka on 29 March, a complex vertical profile of aerosols below 5 km height is observed. That is, low concentrations at heights of 1-2 km and high concentrations at the other heights, which are not reproduced in simulation and assimilation. This indicates that it can be difficult to reproduce the observed vertical profiles of the aerosols by assimilating the 2-dimensional AOT retrieved from GCOM-C/SGLI. To minimize this gap, the NICAM-Chem model itself needs to be improved.
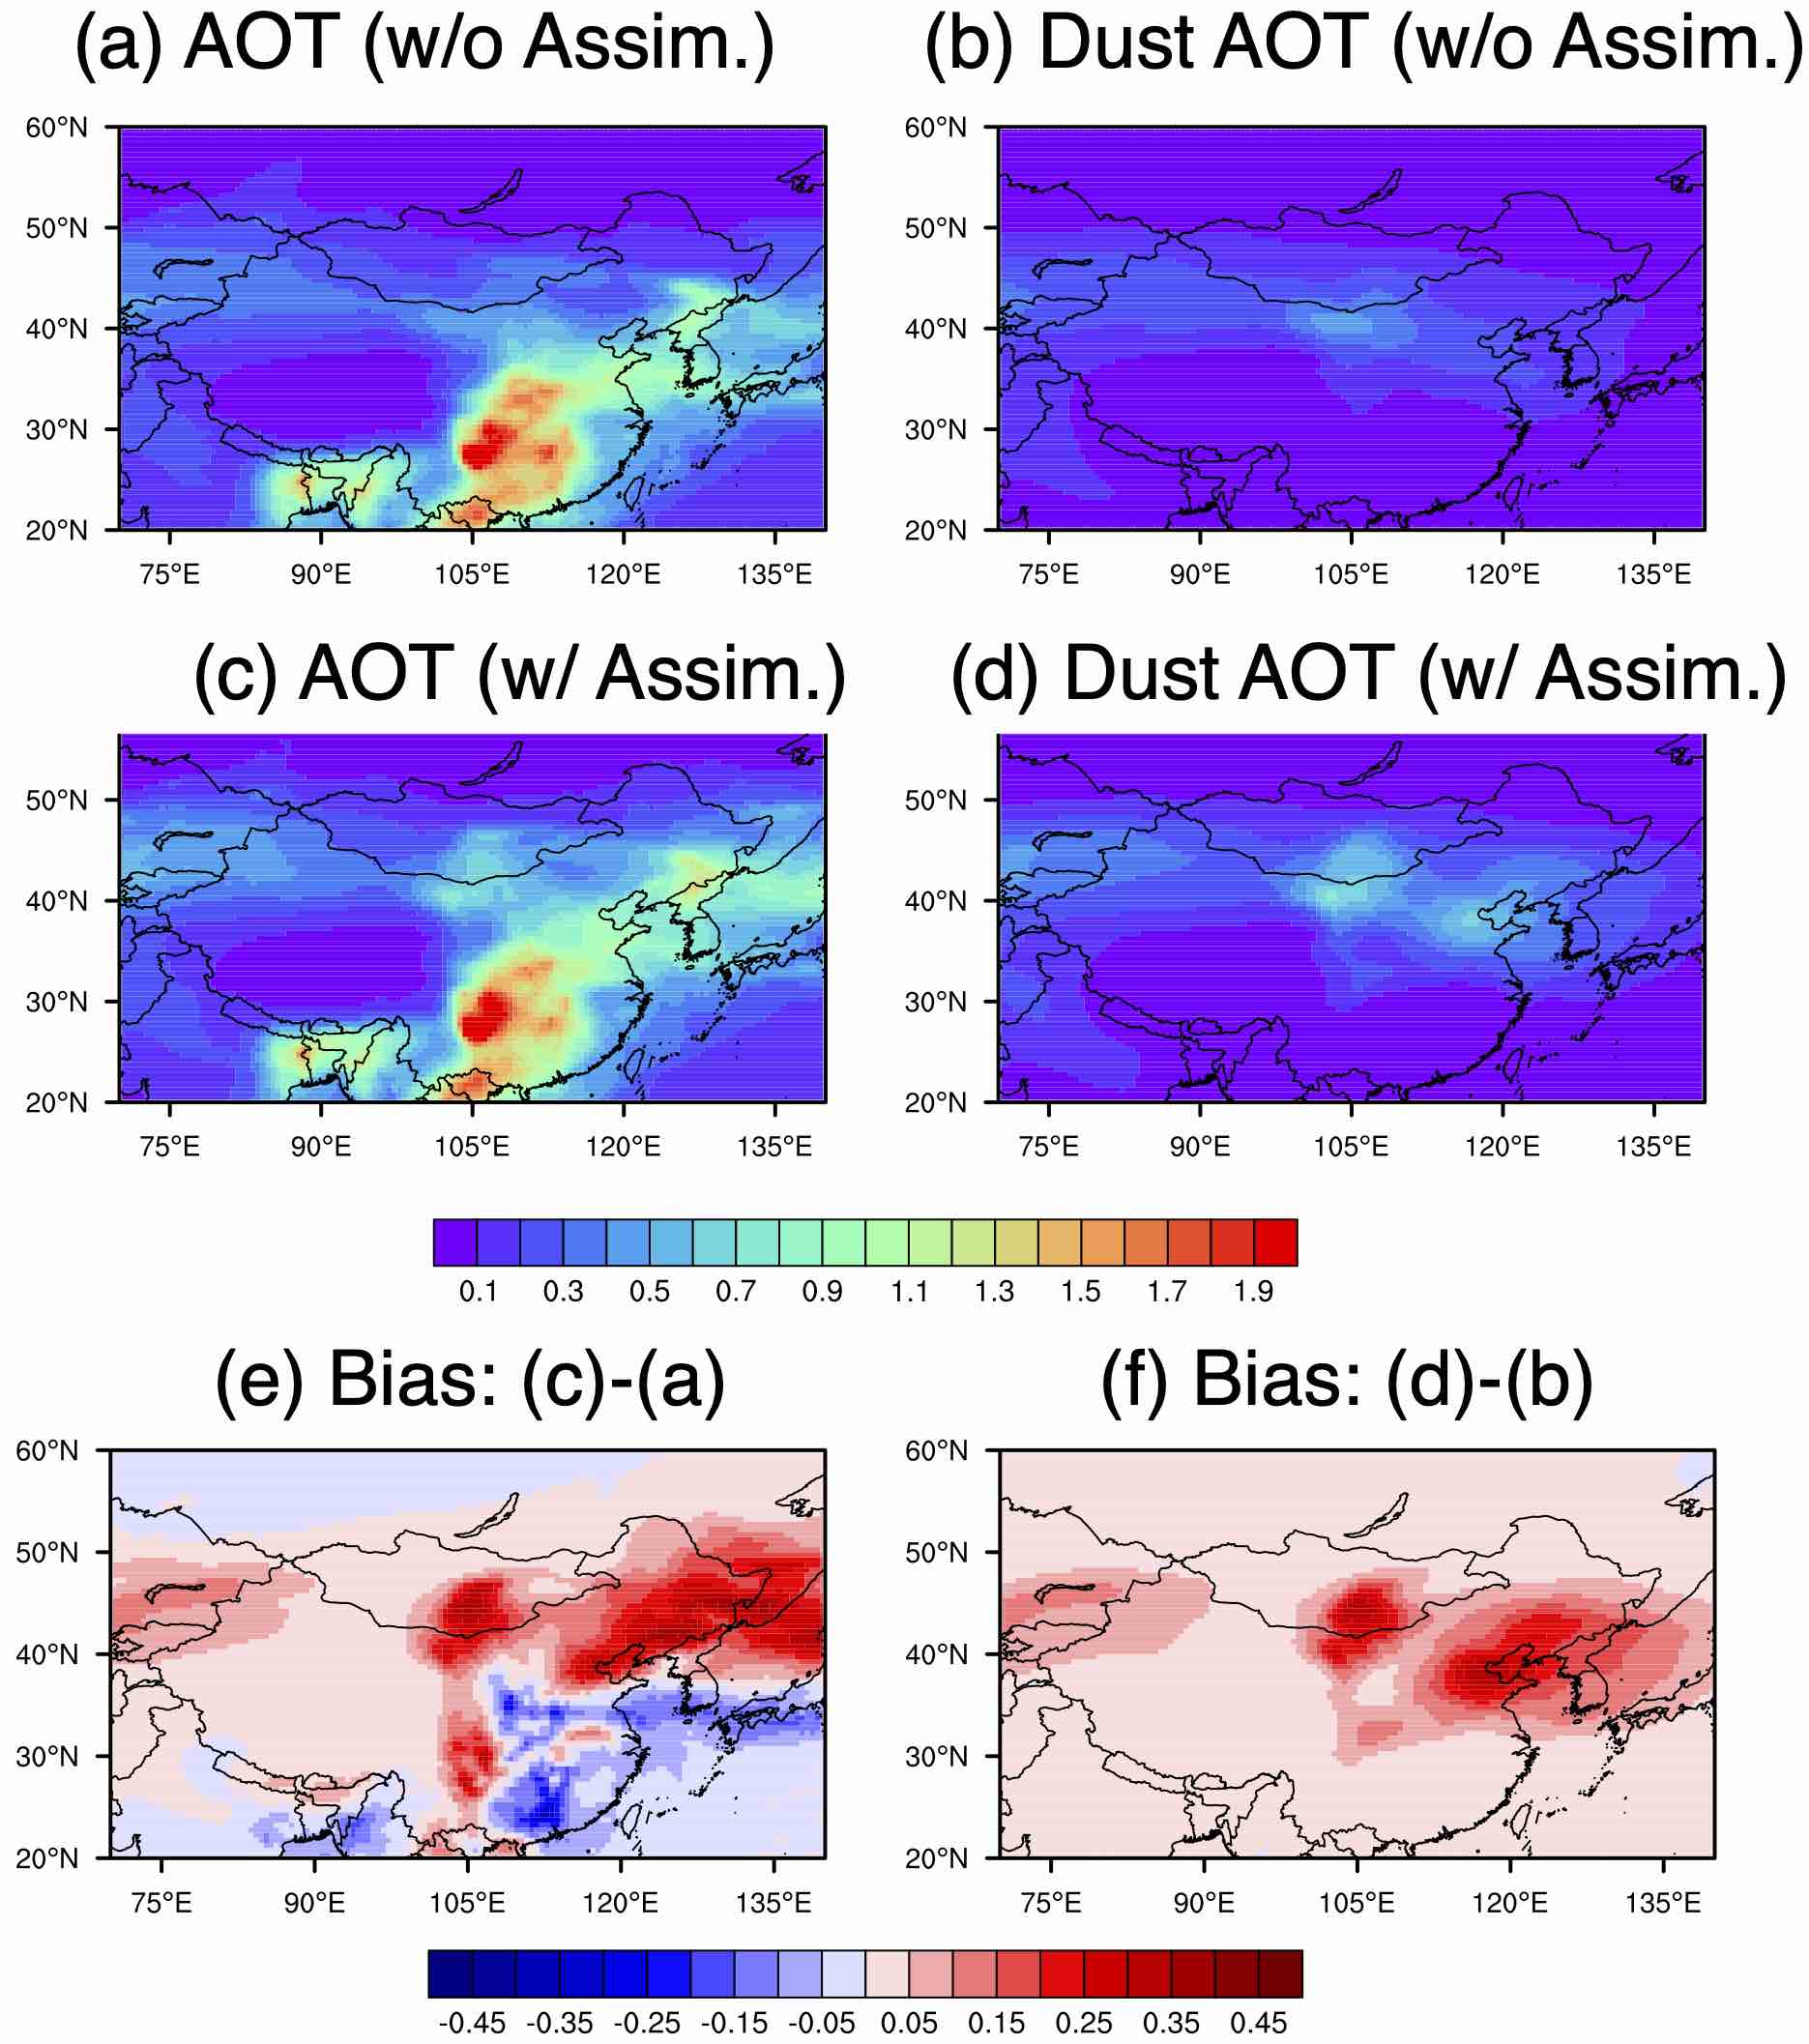
Fig.1: NICAM-Chem simulated (a) total AOT and (b) dust AOT, NICAM-Chem assimilated (c) total AOT and (d) dust AOT, (e) the difference between the assimilated and simulated total AOT and (f) the difference between the assimilated and simulated dust AOT for averages in 23-31 March 2018.
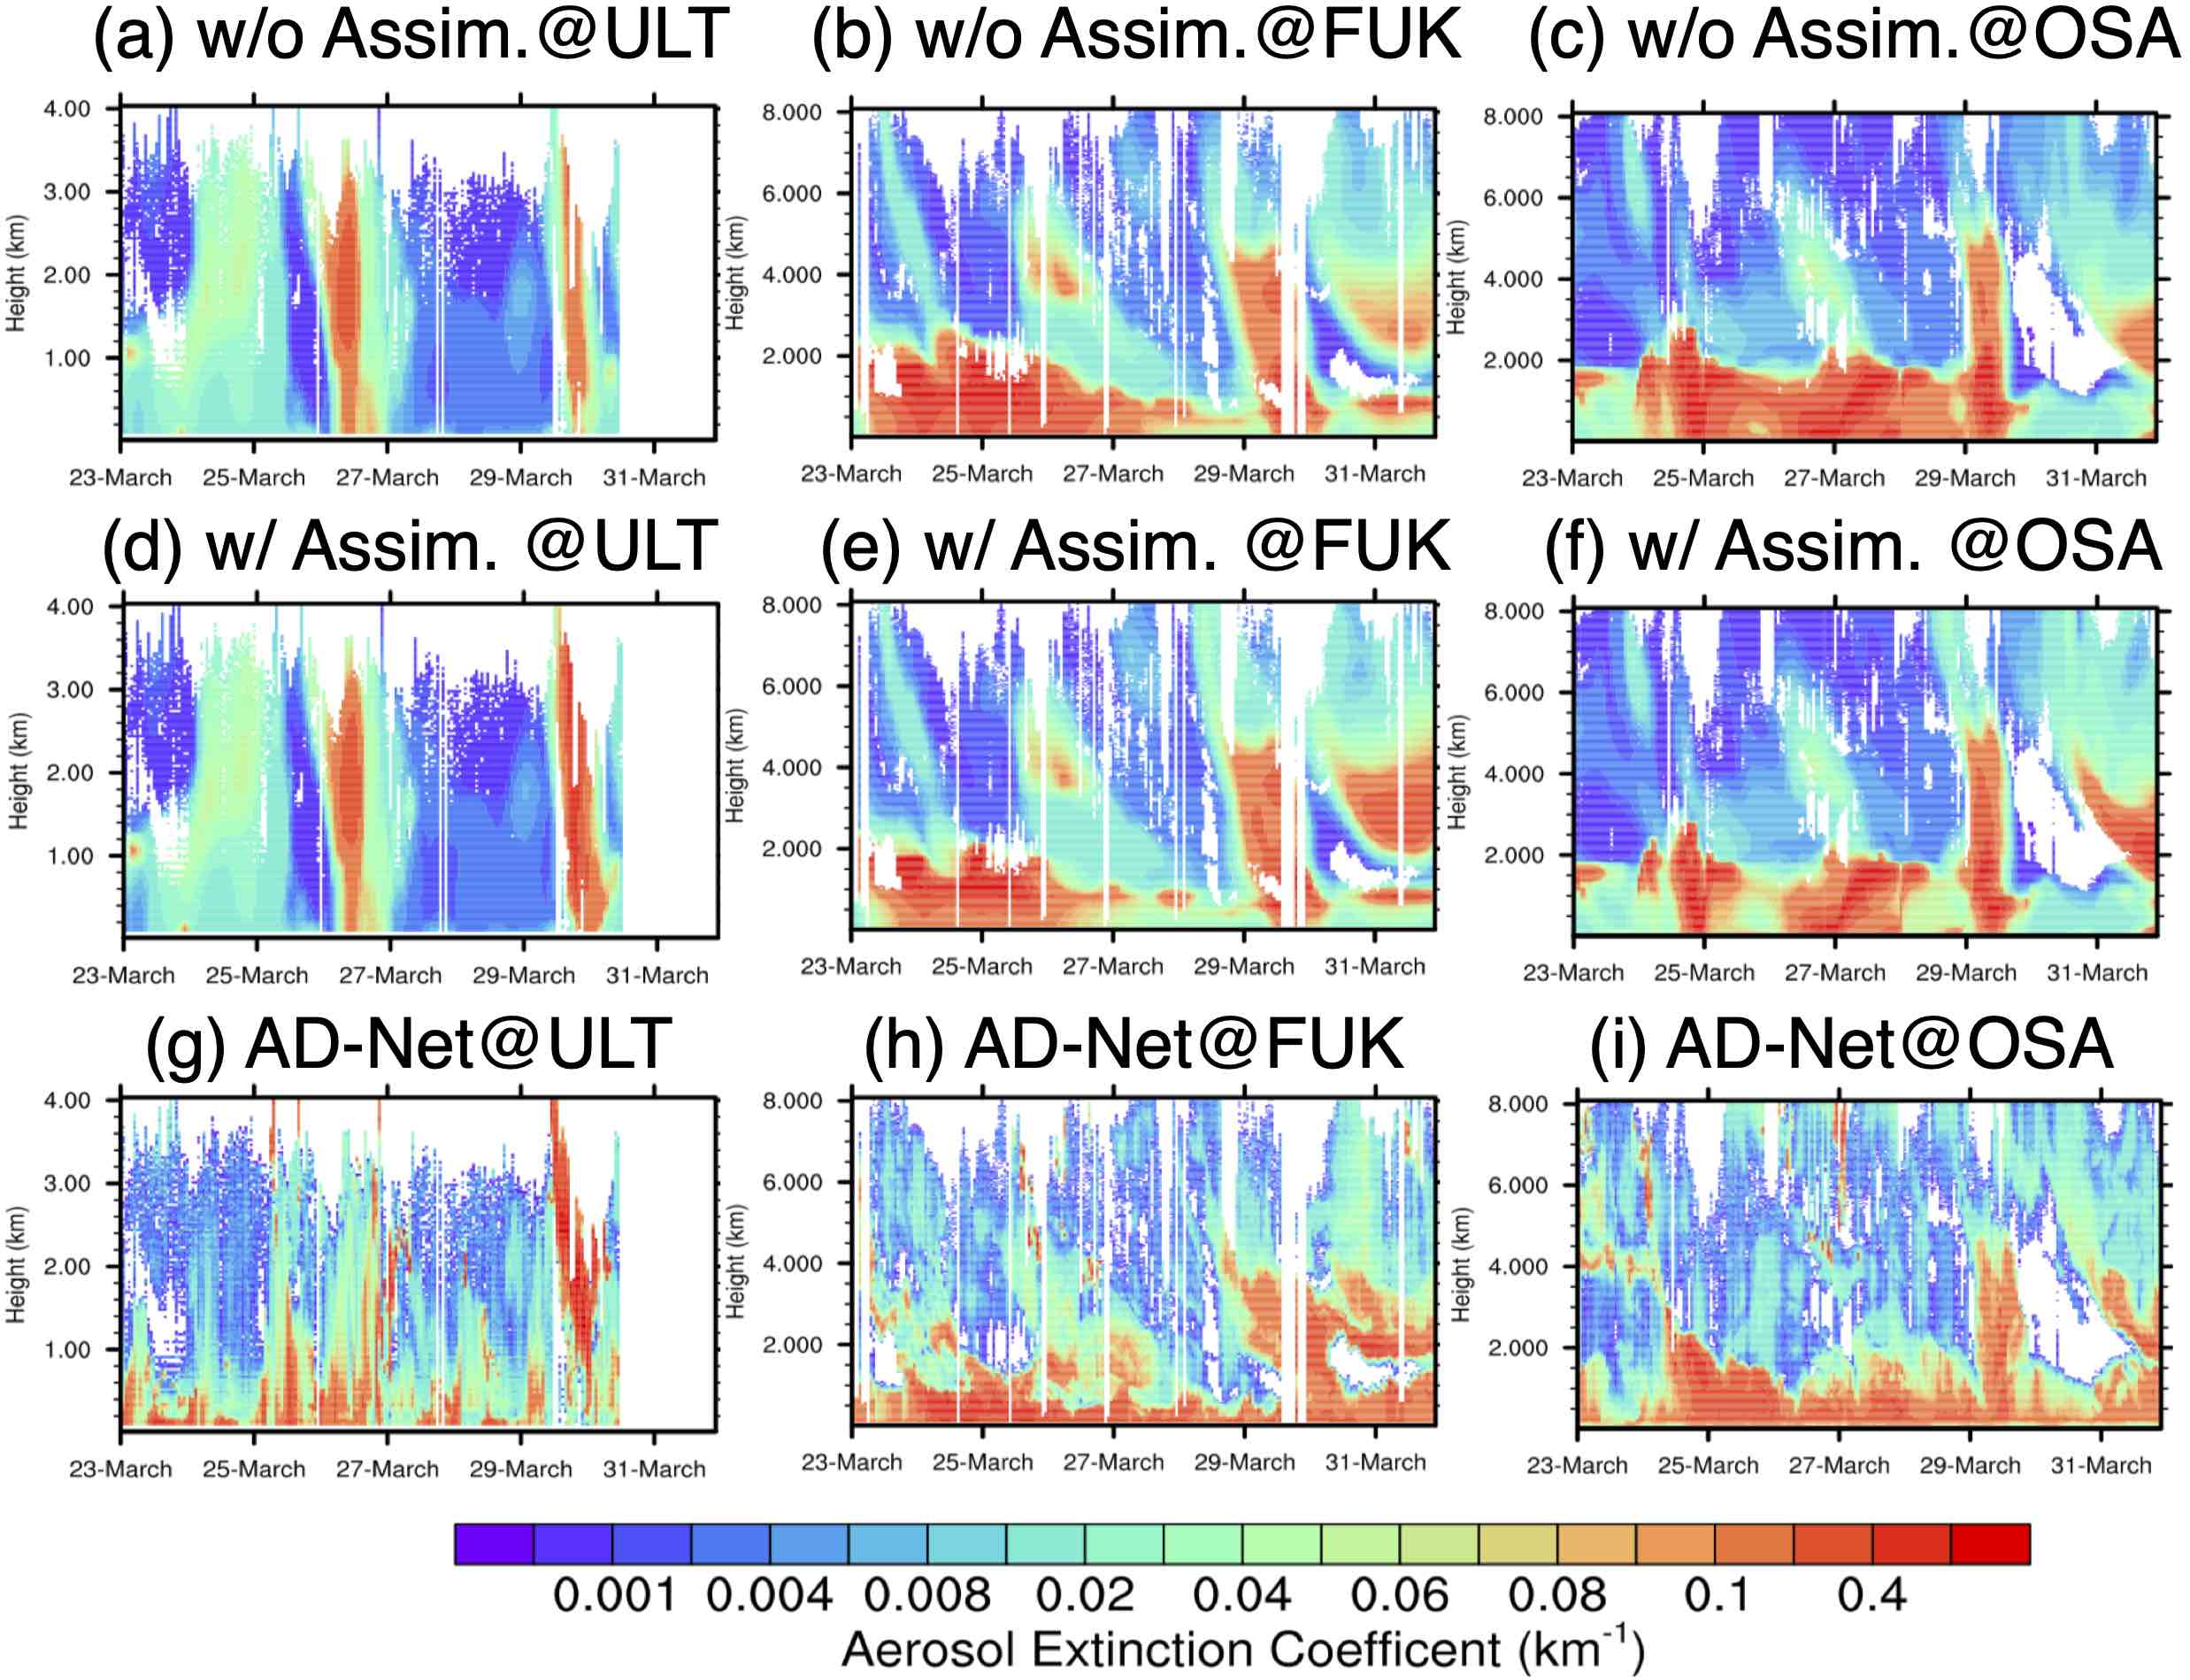
Fig.2: Vertical profiles of the aerosol extinction at (a,d,g) Ulaanbaatar (ULT), (b,e,h) Fukuoka and (c,f,i) Osaka by including (a,b,c) simulated results, (d,e,f) assimilated results and (g,h,i) observation by AD-Net during 23-31 March 2018.
Publications
- Peer-reviewed papers
Goto D., Sato Y., Yashiro H., Suzuki K., Oikawa E., Kudo R., Nagao T.M., Nakajima T. (2020) Global aerosol simulations using NICAM.16 on a 14 km grid spacing for a climate study: improved and remaining issues relative to a lower-resolution model. Geoscientific Model Development, 13, 3731-3768, doi:10.5194/gmd-13-3731-2020.
Goto D., Morino Y., Ohara T., Sekiyama T.T., Uchida J., Nakajima T. (2020) Application of linear minimum variance estimation to the multi-model ensemble of atmospheric radioactive Cs-137 with observations. Atmospheric Chemistry and Physics, 20, 3589-3607, doi:10.5194/acp-20-3589-2020.
Usage of JSS
Computational Information
- Process Parallelization Methods: MPI
- Thread Parallelization Methods: Automatic Parallelization
- Number of Processes: 1 - 160
- Elapsed Time per Case: 20 Hour(s)
Resources Used(JSS2)
Fraction of Usage in Total Resources*1(%): 0.19
Details
Please refer to System Configuration of JSS2 for the system configuration and major specifications of JSS2.
| System Name | Amount of Core Time(core x hours) | Fraction of Usage*2(%) |
|---|---|---|
| SORA-MA | 1,059,004.62 | 0.20 |
| SORA-PP | 0.00 | 0.00 |
| SORA-LM | 0.00 | 0.00 |
| SORA-TPP | 0.00 | 0.00 |
| File System Name | Storage Assigned(GiB) | Fraction of Usage*2(%) |
|---|---|---|
| /home | 1,449.36 | 1.33 |
| /data | 29,959.92 | 0.58 |
| /ltmp | 9,719.13 | 0.83 |
| Archiver Name | Storage Used(TiB) | Fraction of Usage*2(%) |
|---|---|---|
| J-SPACE | 0.00 | 0.00 |
*1: Fraction of Usage in Total Resources: Weighted average of three resource types (Computing, File System, and Archiver).
*2: Fraction of Usage:Percentage of usage relative to each resource used in one year.
Resources Used(JSS3)
Fraction of Usage in Total Resources*1(%): 0.01
Details
Please refer to System Configuration of JSS3 for the system configuration and major specifications of JSS3.
| System Name | Amount of Core Time(core x hours) | Fraction of Usage*2(%) |
|---|---|---|
| TOKI-SORA | 0.00 | 0.00 |
| TOKI-RURI | 0.00 | 0.00 |
| TOKI-TRURI | 0.00 | 0.00 |
| File System Name | Storage Assigned(GiB) | Fraction of Usage*2(%) |
|---|---|---|
| /home | 481.38 | 0.33 |
| /data | 9,811.04 | 0.16 |
| /ssd | 140.78 | 0.07 |
| Archiver Name | Storage Used(TiB) | Fraction of Usage*2(%) |
|---|---|---|
| J-SPACE | 0.00 | 0.00 |
*1: Fraction of Usage in Total Resources: Weighted average of three resource types (Computing, File System, and Archiver).
*2: Fraction of Usage:Percentage of usage relative to each resource used in one year.
JAXA Supercomputer System Annual Report April 2020-March 2021