
Research on rotor blade optimization between JAXA-ONERA-DLR : Validation of CFD solvers
JAXA Supercomputer System Annual Report April 2020-March 2021
Report Number: R20ECMP11
Subject Category: Competitive Funding
- Responsible Representative: Yasutada Tanabe, Aeronautical Technology Directorate, Aviation Systems Research Unit
- Contact Information: Keita Kimura(kimura.keita@jaxa.jp)
- Members: Yasutada Tanabe, Masahiko Sugiura, Hideaki Sugawara, Kuniyuki Takekawa, Keita Kimura
Abstract
In order to verify and accumulate knowledge of the analysis tools and optimization methods of helicopter blades possessed by JAXA, DLR, and ONERA, each organization has been optimizing blade shapes under various flight conditions. In this fiscal year, as the first step, blade optimization under hovering conditions and comparison of numerical simulation results were carried out. In an optimization process, it is necessary to evaluate the performance of the obtained design solution accurately, and the evaluation by CFD is important for the design considering local fluid phenomena. In this report, we share some of the validation results of CFD analysis conducted by each organizations.
Reference URL
N/A
Reasons and benefits of using JAXA Supercomputer System
In the optimization using CFD, it is necessary to conduct many cases with different design variables, and the use of supercomputers is essential. DLR/ONERA also conduct similar process using HPC, and it is appropriate to compare and examine the results using supercomputers.
Achievements of the Year
As for the CFD solver, which is responsible for the performance evaluation of the design solution in the optimization tool, the validity of the CFD solvers owned by each organizations (JAXA, ONERA and DLR) was confirmed by comparing the CFD simulations of the baseline shape in hovering conditions.
Figure 1 depicts the overview of computational grids in JAXA's cases. Simulations were performed using a moving overlapped grid system solver (rFlow3D) in which the blade grid rotates in a background grid.
Figure 2 shows a comparison of figure-of-merit, a measure of hovering performance. The horizontal axis represents the magnitude of the thrust generated by the blade. Each CFD result were compared with the experimental values and they were confirmed that the hovering performance was comparable over a wide range of thrust, and that the validity was sufficient for use as a performance prediction tool.
Figure 3 illustrates the skin friction distribution on the blade surface at a representative cross section. The turbulence modeling used by each agency is different, and the variance in friction around the leading edge (x/c~0.1) can be seen. It mainly appears in the performance prediction results in Fig.2, and it is confirmed that the difference is within a reasonable range.
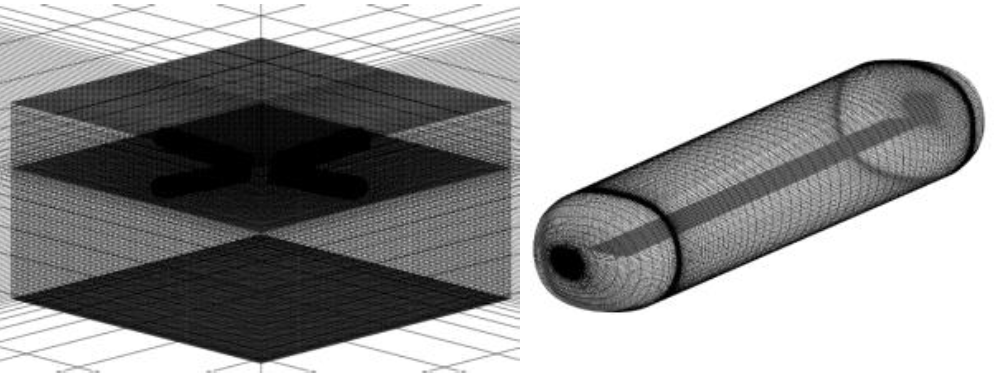
Fig.1: computational grid
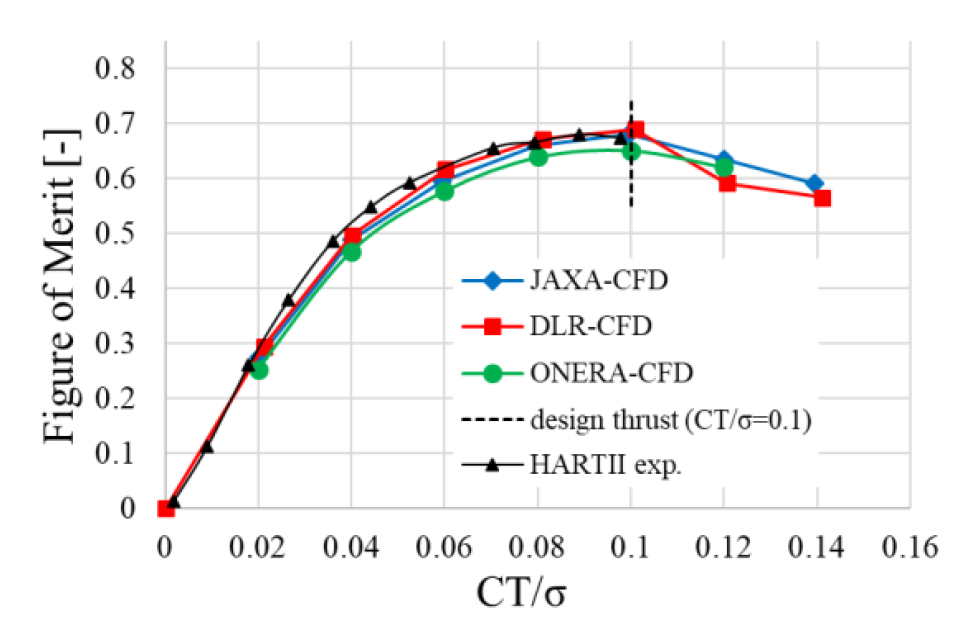
Fig.2: Rotor thrust vs Figure of Merit (efficiency)
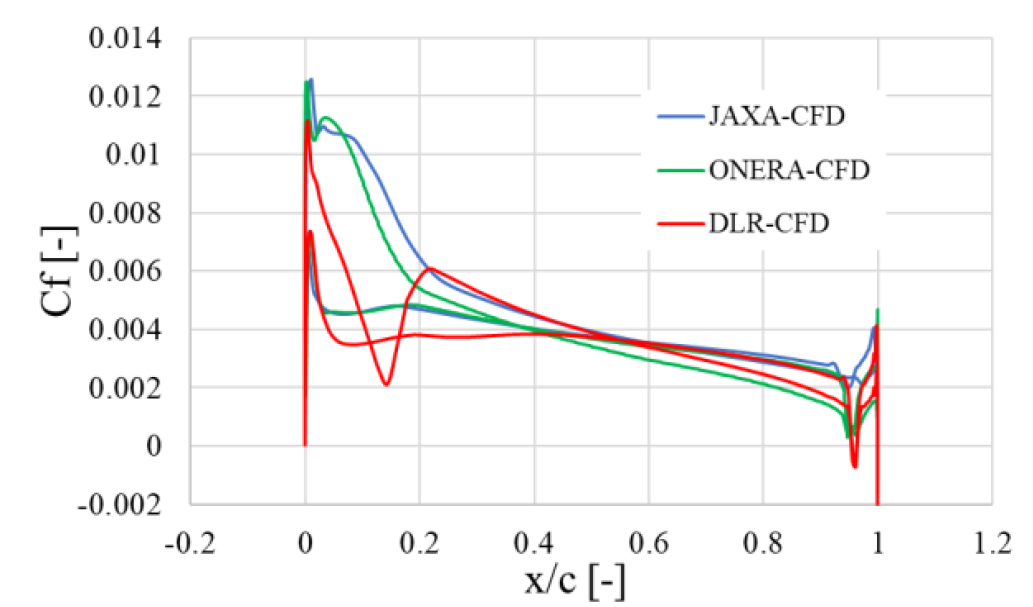
Fig.3: Skin frictional coefficient
Publications
- Non peer-reviewed papers
KIMURA Keita , SUGIURA Masahiko , SUGAWARA Hideaki , TANABE Yasutada , WILKE Gunther , BAILLY Joelle , TAKEKAWA Kuniyuki, "Cooperative Research on Rotor Blade Optimization between JAXA-ONERA-DLR: Results of Phase I",JAXA Special Publication: Proceedings of Fluid Dynamics Conference / Aerospace Numerical Simulation Symposium 2020 Online,JAXA-SP-20-008,59-67 (2021-02-08)
- Oral Presentations
KIMURA Keita , SUGIURA Masahiko , SUGAWARA Hideaki , TANABE Yasutada , WILKE Gunther , BAILLY Joelle , TAKEKAWA Kuniyuki, "Cooperative Research on Rotor Blade Optimization between JAXA-ONERA-DLR: Results of Phase I",Fluid Dynamics Conference / Aerospace Numerical Simulation Symposium 2020 Online, September 28-30, 2020.
Usage of JSS
Computational Information
- Process Parallelization Methods: N/A
- Thread Parallelization Methods: OpenMP
- Number of Processes: 1
- Elapsed Time per Case: 200 Hour(s)
Resources Used(JSS2)
Fraction of Usage in Total Resources*1(%): 0.60
Details
Please refer to System Configuration of JSS2 for the system configuration and major specifications of JSS2.
| System Name | Amount of Core Time(core x hours) | Fraction of Usage*2(%) |
|---|---|---|
| SORA-MA | 689,493.57 | 0.13 |
| SORA-PP | 563,193.90 | 4.41 |
| SORA-LM | 1,583.29 | 0.93 |
| SORA-TPP | 104,624.97 | 9.87 |
| File System Name | Storage Assigned(GiB) | Fraction of Usage*2(%) |
|---|---|---|
| /home | 3,603.33 | 3.30 |
| /data | 6,886.43 | 0.13 |
| /ltmp | 955.59 | 0.08 |
| Archiver Name | Storage Used(TiB) | Fraction of Usage*2(%) |
|---|---|---|
| J-SPACE | 6.24 | 0.21 |
*1: Fraction of Usage in Total Resources: Weighted average of three resource types (Computing, File System, and Archiver).
*2: Fraction of Usage:Percentage of usage relative to each resource used in one year.
Resources Used(JSS3)
Fraction of Usage in Total Resources*1(%): 0.77
Details
Please refer to System Configuration of JSS3 for the system configuration and major specifications of JSS3.
| System Name | Amount of Core Time(core x hours) | Fraction of Usage*2(%) |
|---|---|---|
| TOKI-SORA | 422,205.40 | 0.09 |
| TOKI-RURI | 1,031,095.38 | 5.90 |
| TOKI-TRURI | 140,829.28 | 11.35 |
| File System Name | Storage Assigned(GiB) | Fraction of Usage*2(%) |
|---|---|---|
| /home | 4,602.21 | 3.15 |
| /data | 12,181.43 | 0.20 |
| /ssd | 1,082.17 | 0.57 |
| Archiver Name | Storage Used(TiB) | Fraction of Usage*2(%) |
|---|---|---|
| J-SPACE | 6.24 | 0.21 |
*1: Fraction of Usage in Total Resources: Weighted average of three resource types (Computing, File System, and Archiver).
*2: Fraction of Usage:Percentage of usage relative to each resource used in one year.
JAXA Supercomputer System Annual Report April 2020-March 2021