
Atmospheric Environmental Monitoring Simulation
JAXA Supercomputer System Annual Report April 2019-March 2020
Report Number: R19ER2401
Subject Category: Space Technology
- Responsible Representative: Hiroshi Murakami, Reaserch area leader, JAXA Earth Observation Research Center
- Contact Information: Hiroshi Murakami(murakami.hiroshi.eo@jaxa.jp)
- Members: Daisuke Goto, Tie Dai, Yueming Cheng, Hiroshi Murakami
Abstract
This project is aimed at development of an integrated system of numerical modeling and satellite observation of air pollution for its reliable monitoring and prediction. Specially, an atmospheric air pollution transport model (NICAM-Chem) with a data assimilation technique using atmospheric aerosol products retrieved from GCOM-C/SGLI is developed as a prototype for the next generation forecast system in NIES, named VENUS. As a result, the system can reproduce much realistic air pollutions than ever before.
Reference URL
Please refer to 'Atmosphere | Earth observation research | JAXA Earth Observation Research Center (EORC)'.
Reasons and benefits of using JAXA Supercomputer System
In the project, we need to conduct numerical simulations and assimilations with higher spatial grid spacings over wide area for reliable monitoring and predictions of air pollutions over the region. This requires us to exploit high performance super computing resources of JAXA Supercomputer System 2 (JSS2) available at JAXA.
Achievements of the Year
We simulated aerosols in a global scale using an atmospheric air pollution model (NICAM-Chem). Especially, we focused on a remarkable dust transport from Saharan desert to East Asia including Japan on the end of March 2018. The horizontal resolution of NICAM-Chem is set at 56 km, which is the highest resolution among the assimilated simulations. The assimilation technique is a Localized Ensemble Kalman Transform Filter (LETKF) for aerosol simulation. Three numerical experiments were conducted as follows: (1) Without assimilation, (2) With assimilation with aerosol optical thickness (AOT) retrieved from GCOM-C/SGLI and (3) With assimilation with AOT from GCOM-C/SGLI and 3-dimensional aerosol extinction (Cext) retrieved from CALIPSO/CALIOP.
Figure 1 shows a horizontal distribution of both simulated and assimilated AOT on 23UST 27 March 2018 where a dust plume reaches Japan. Over the Saharan desert, the simulated AOT, i.e., non-assimilated AOT, tends to be overestimated compared to the assimilated AOT with only GCOM-C/SGLI, whereas the assimilated AOT with both GCOM-C/SGLI and CALIPSO/CALIOP are higher than the assimilated AOT with only GCOM-C/SGLI. It suggests that the AOT retrieved from GCOM-C/SGLI over the Saharan desert is underestimated compared to the real values. The AERONET measurement, which is independent from the assimilation in this study, were used in the validation. The comparison was conducted at Zanjan in Iran near the Saharan desert (Figure 2). The assimilated results provided higher correlation coefficient and lower room mean square error (RMSE), which shows the improvement of the model reproductivity, even though the limited numbers of the AERONET measurements. In the next fiscal year, we develop a data quality control and reproduce more realistic air pollutions captured by multiple measurements.
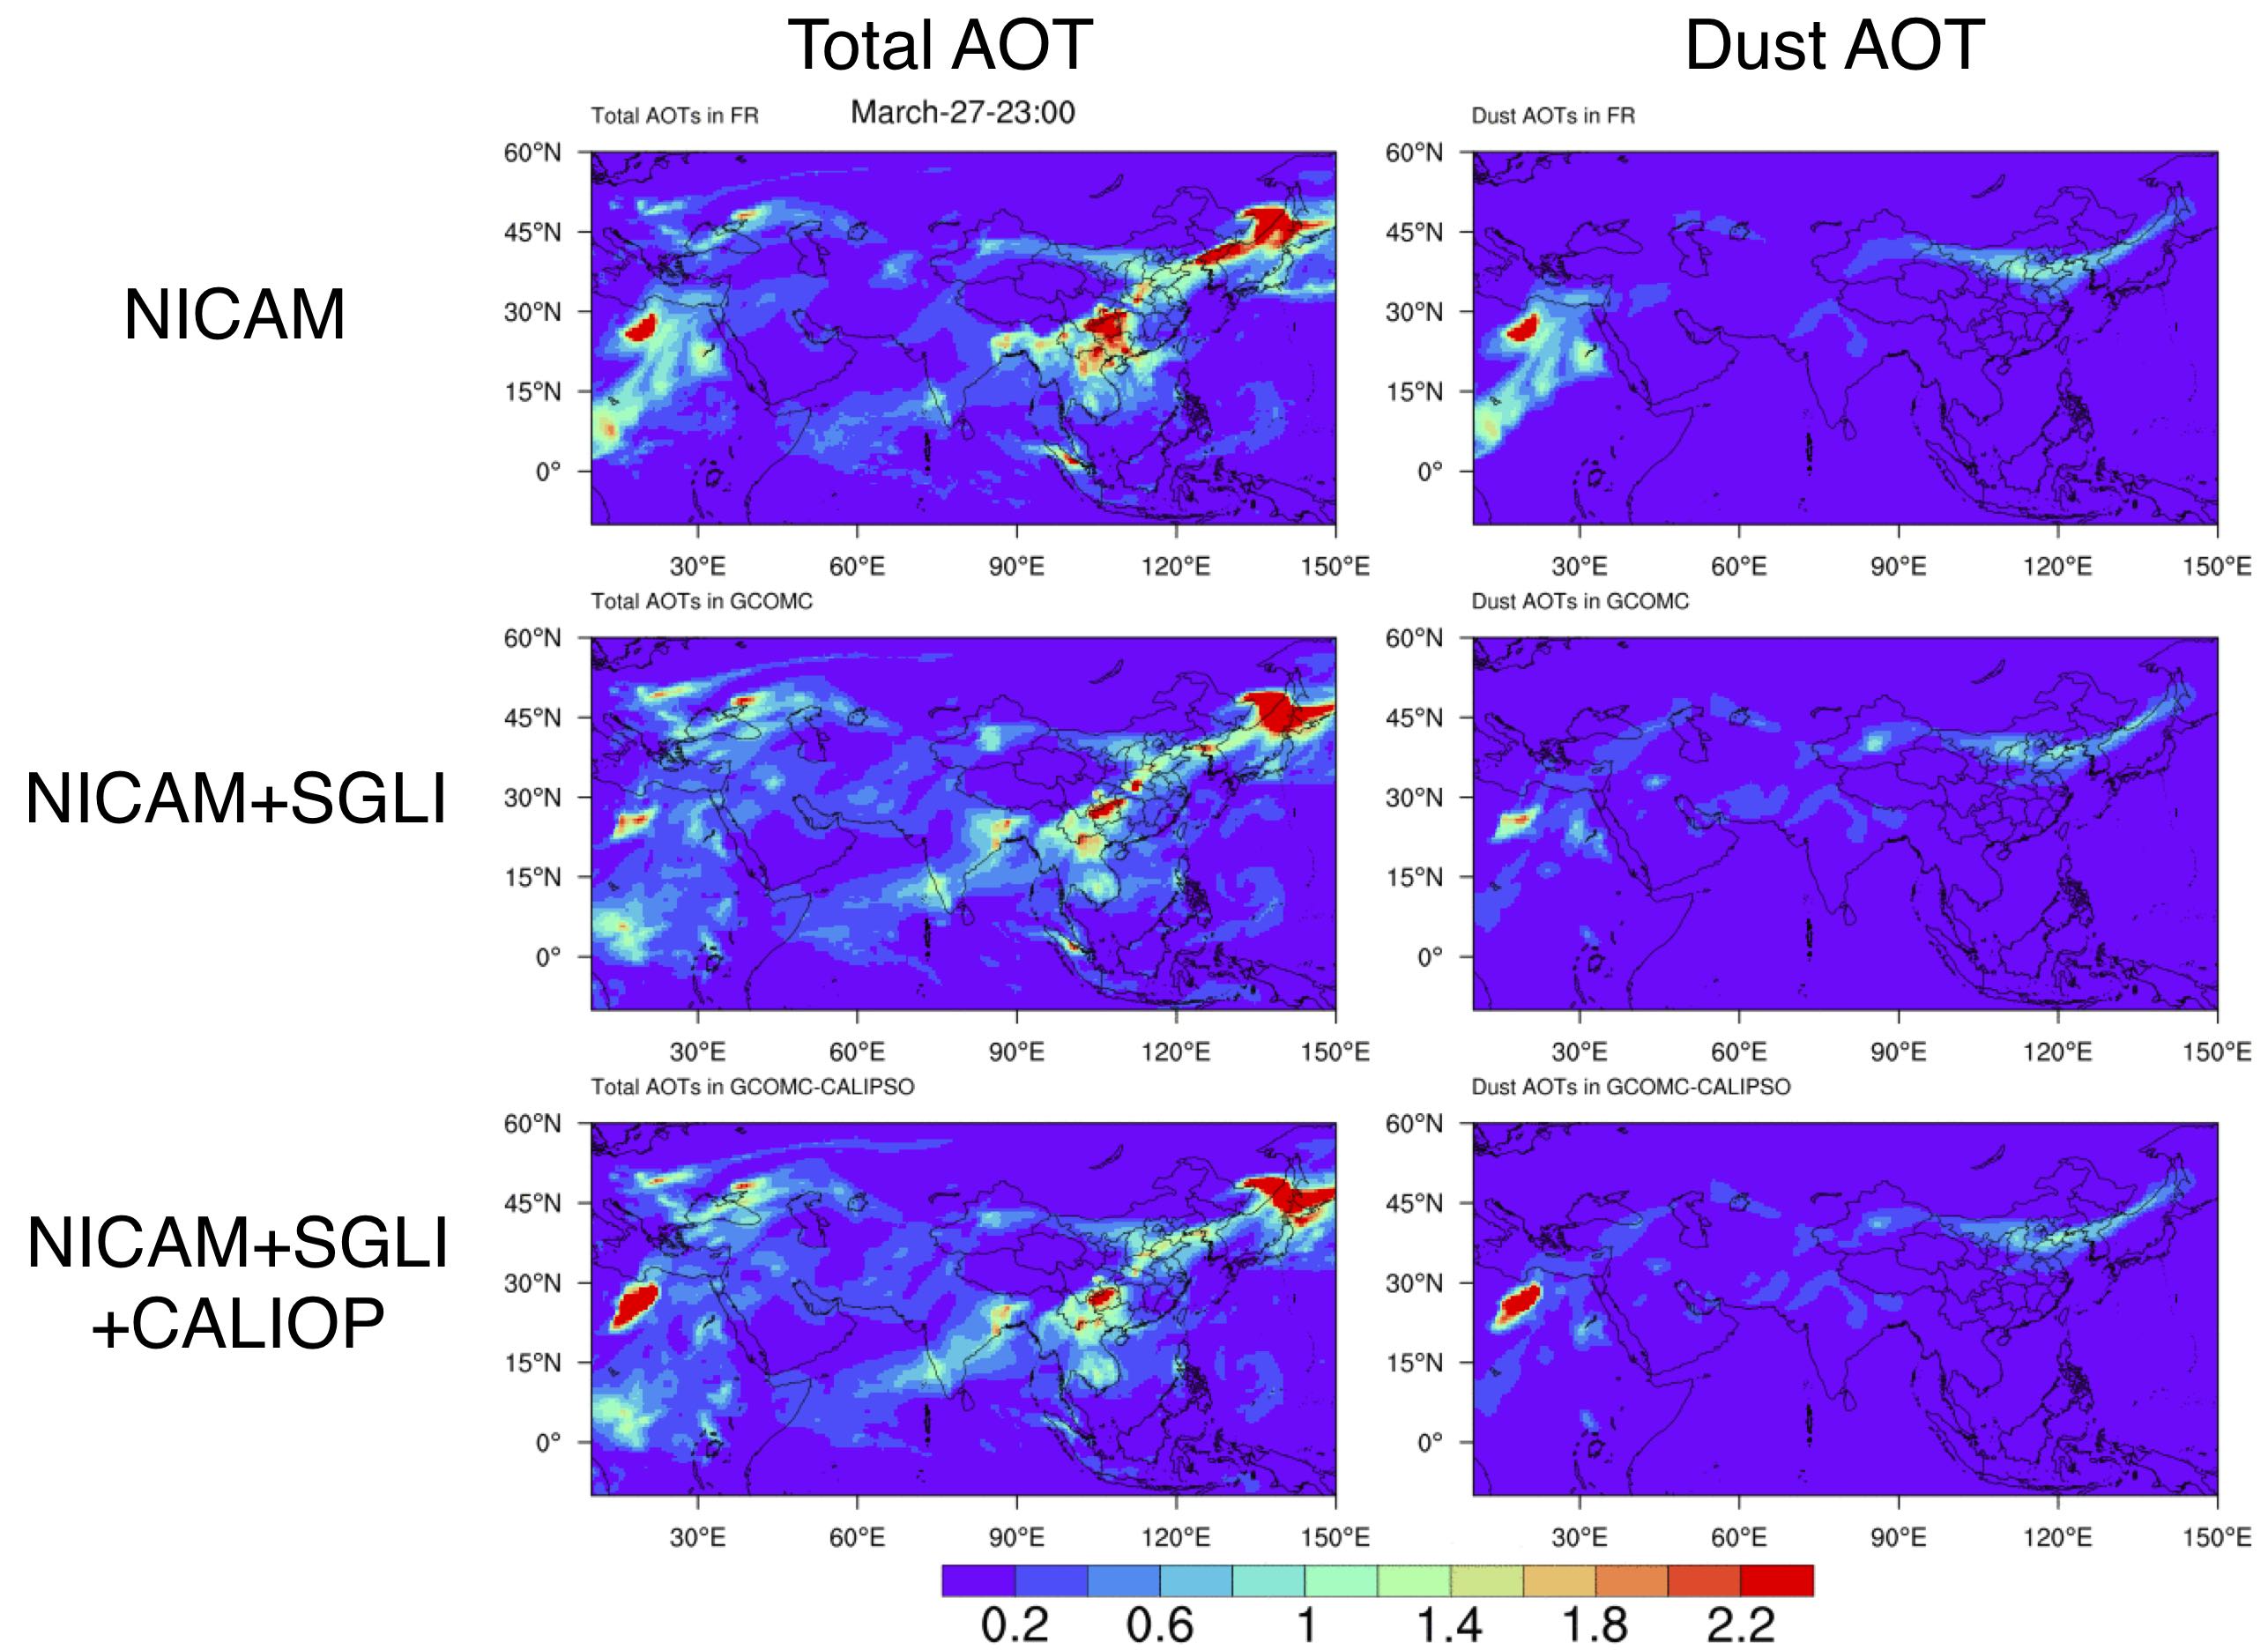
Fig.1: A horizontal distribution of simulated and assimilated aerosol optical thickness (total AOT) and dust AOT. The results are three: NICAM-Chem without assimilation (upper panels), NICAM-Chem with assimilation using GCOM-C/SGLI (middle panels) and NICAM-Chem with assimilation using both GCOM-C/SGLI and CALIPSO/CALIOP (lower panels).
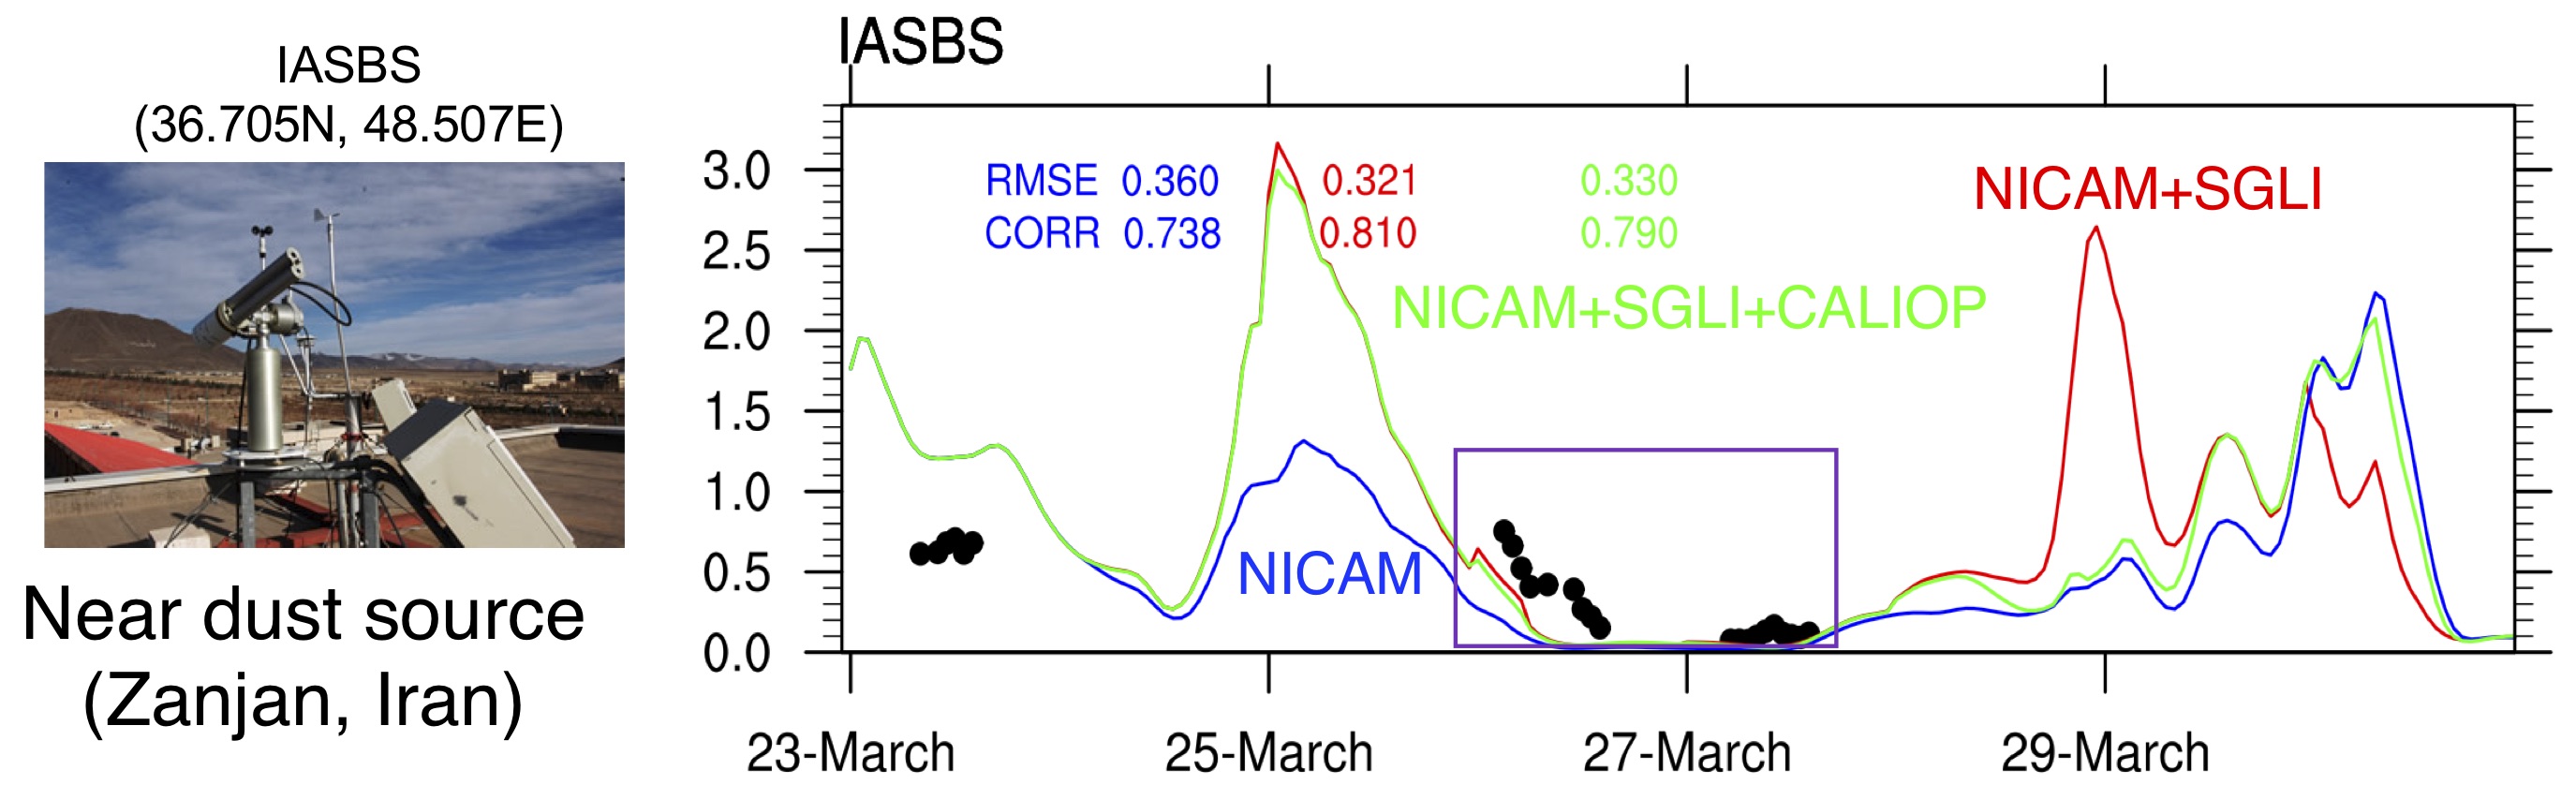
Fig.2: Temporal variation of AOT at Zanjan, Iran in the end of March 2018. The black circle represents the AERONET measurement, the blue line represents NICAM-Chem without assimilation, the red line represents NICAM-Chem with assimilation using GCOM-C/SGLI and the green line represents NICAM-Chem with assimilation using both GCOM-C/SGLI and CALIPSO/CALIOP. The RMSE and correlation coefficient (CORR) are also shown in the right panel.
Publications
- Peer-reviewed papers
Cheng Y., Dai T., Goto D., Schutgens N.A.J., Shi G., Nakajima T. (2019) Investigating the assimilation of CALIPSO global aerosol vertical observations using Four-Dimensional Ensemble Kalman Filter. Atmospheric Chemistry and Physics, 19, 13445-13467, doi:10.5194/acp-19-13445-2019.
Dai T., Cheng Y., Goto D., Schutgens N.A.J., Kikuchi M., Yoshida M., Shi G., Nakajima T. (2019) Inverting the East Asian Dust Emission Fluxes Using the Ensemble Kalman Smoother and Himawari-8 AODs: A Case Study with WRF-Chem v3.5.1. Atmosphere, 10, 543, doi:10.3390/atmos10090543.
Goto D., Morino Y., Ohara T., Sekiyama T. T., Uchida J., Nakajima T. (2020) Application of linear minimum variance estimation to the multi-model ensemble of atmospheric radioactive Cs-137 with observations. Atmospheric Chemistry and Physics, 20, 3589-3607, doi:10.5194/acp-20-3589-2020.
- Oral Presentations
Goto D., Sugata S., Dai T., Cheng Y., Nakajima T. (2019) Application of a multi-model ensemble method for PM2.5 estimation, 16th Annual Meeting: Asia Oceania Geosciences Society (AOGS), Singapore, Singapore, August 2019
- Poster Presentations
Goto D., Morino, Y., Ohara, T., Sekiyama, T. T., Uchida, J., Nakajima, T., (2019) Development of multi-model ensemble method for radionuclides released from Fukushima nuclear accident, 2019 American Geophysical Union (AGU) Fall Meeting, San Francisco, USA, December 2019
Usage of JSS2
Computational Information
- Process Parallelization Methods: MPI
- Thread Parallelization Methods: Automatic Parallelization
- Number of Processes: 1 - 160
- Elapsed Time per Case: 20 Hour(s)
Resources Used
Fraction of Usage in Total Resources*1(%): 0.14
Details
Please refer to System Configuration of JSS2 for the system configuration and major specifications of JSS2.
| System Name | Amount of Core Time(core x hours) | Fraction of Usage*2(%) |
|---|---|---|
| SORA-MA | 1,167,068.41 | 0.14 |
| SORA-PP | 0.00 | 0.00 |
| SORA-LM | 0.00 | 0.00 |
| SORA-TPP | 0.00 | 0.00 |
| File System Name | Storage Assigned(GiB) | Fraction of Usage*2(%) |
|---|---|---|
| /home | 1,648.27 | 1.37 |
| /data | 39,984.40 | 0.68 |
| /ltmp | 13,346.36 | 1.13 |
| Archiver Name | Storage Used(TiB) | Fraction of Usage*2(%) |
|---|---|---|
| J-SPACE | 0.00 | 0.00 |
*1: Fraction of Usage in Total Resources: Weighted average of three resource types (Computing, File System, and Archiver).
*2: Fraction of Usage:Percentage of usage relative to each resource used in one year.
JAXA Supercomputer System Annual Report April 2019-March 2020