High-fidelity numerical simulation of compressible turbulent flows
JAXA Supercomputer System Annual Report April 2019-March 2020
Report Number: R19EACA37
Subject Category: JSS2 Inter-University Research
- Responsible Representative: Soshi Kawai, Professor, Department of Aerospace Engineering, Tohoku University
- Contact Information: Ryo Kamogawa(kamogawa@klab.mech.tohoku.ac.jp)
- Members: Soshi Kawai, Sayako Ishitsuka, Ryo Kamogawa
Abstract
In this study, wall-resolved large-eddy simulation (WRLES) and wall-modeled LES (WMLES) were conducted to clarify the mechanisms of turbulence generation in WMLES, and also to investigate the predictability of WMLES of the separated flow. From the results, we found that the near-wall LES grid-scale turbulence structures behaves as the pseudo streak-like structures, which act as the streaks and lead to the turbulence generation. We also observed that the mean velocity and Reynolds shear stress obtained by the WMLES show a good agreement with the WRLES in the separated flow although the skin friction slightly deviates from the WRLES results.
Reference URL
N/A
Reasons and benefits of using JAXA Supercomputer System
In this study, high-fidelity WRLES was carried out as a reference database to evaluate and analyze the WMLES data. The WRLES requires high computational cost to resolve the small turbulent structures in the inner-layer. Therefore, massively parallel computations using supercomputer, such as the JSS2, are required.
Achievements of the Year
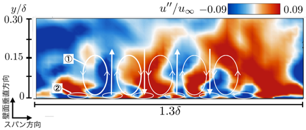
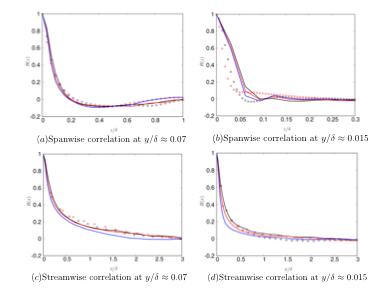
(a) In this study, we conducted WRLES and WMLES of the flat plate turbulent boundary layers and investigated the mechanisms of near-wall turbulence generation in WMLES. The mechanisms of turbulence generation in WMLES are investigated by comparing the turbulence statistics and the instantaneous velocity fluctuations obtained by the WMLES and WRLES database. In the WMLES, the near-wall turbulence structures show ejection and sweep events with the two-layer structures, structures very close to the wall and its above near outer-layer (figure 1). From figure 2, the turbulent structures near the outer layer is resolved by the LES grid, and is found that the length scale is almost matched to the length scale obtained by the WRLES. The other structures very near the wall has a non-physical spanwise length scale that depends on the grid scale (and not physics). The streamwise length scale of these non-physical structures is close to that of the WRLES. Thereby, the near-wall LES grid-scale structures behave as the pseudo streak-like structures, and lead to the generation of the Reynolds stress and accurate prediction of the outer layer turbulence statistics.
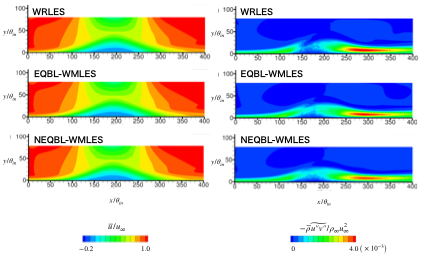
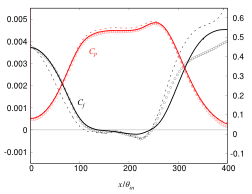
(b) WMLESs with equilibrium (EQBL) and non-equilibrium (NEQBL) wall models were conducted for the flat-plate turbulent boundary layers with large adverse and favorable pressure gradients, involving flow separation and reattachment. The predictability of the turbulence statistics obtained by the two types of the wall-models, EQBL and NEQBL models, is investigated by comparing with the turbulence statistics database obtained by WRLES. The Reynolds number based on momentum thickness and the Mach number is equal to 2000 and 0.2, respectively. Both the models with/without the equilibrium boundary layer assumptions show a good agreement with the WRLES results for the mean velocity and Reynolds shear stress (see figure 4) although the skin friction shows a discrepancy (see figure 5). This implies that WMLES can accurately predict the flowfield where the physics in the outer layer turbulence are important because the important physics in the outer layer are accurately resolved by the WMLES.

Fig.1: Instantaneous streamwise velocity fluctuations in flat-plate turbulent boundary layer in spanwise/wall-normal plane obtained by WMLES at Re_(tau) =1400

Fig.2: Auto-correlation of instantaneous streamwise velocity fluctuations in flat-plate turbulent boundary layer at Re_(tau) = 1400

Fig.3: Mean streamwise velocity distributions and Reynolds shear stress distributions in separated/reattached turbulent boundary layer in the x-y plane (a, WRLES; b, equilibrium wall-model; c, non- equilibrium wall-model).

Fig.4: Mean skin friction and wall pressure distributions in separated/reattached turbulent boundary layer (a, WRLES; b, equilibrium wall-model; c, non- equilibrium wall-model).
Publications
– Oral Presentations
S. Ishitsuka and S. Kawai, “Mechanisms of near-wall turbulence generation in wall-modeled large-eddy simulation,” 33th CFD symposium, Sapporo, Japan 2019.
Usage of JSS2
Computational Information
- Process Parallelization Methods: MPI
- Thread Parallelization Methods: OpenMP
- Number of Processes: 15 – 1930
- Elapsed Time per Case: 4000000000 Hour(s)
Resources Used
Fraction of Usage in Total Resources*1(%): 0.02
Details
Please refer to System Configuration of JSS2 for the system configuration and major specifications of JSS2.
| System Name | Amount of Core Time(core x hours) | Fraction of Usage*2(%) |
|---|---|---|
| SORA-MA | 152,565.24 | 0.02 |
| SORA-PP | 0.00 | 0.00 |
| SORA-LM | 0.00 | 0.00 |
| SORA-TPP | 0.00 | 0.00 |
| File System Name | Storage Assigned(GiB) | Fraction of Usage*2(%) |
|---|---|---|
| /home | 13.67 | 0.01 |
| /data | 4,241.31 | 0.07 |
| /ltmp | 2,799.48 | 0.24 |
| Archiver Name | Storage Used(TiB) | Fraction of Usage*2(%) |
|---|---|---|
| J-SPACE | 0.00 | 0.00 |
*1: Fraction of Usage in Total Resources: Weighted average of three resource types (Computing, File System, and Archiver).
*2: Fraction of Usage:Percentage of usage relative to each resource used in one year.
JAXA Supercomputer System Annual Report April 2019-March 2020


