
Physics and modeling of compressible thermal turbulent boundary layers
JAXA Supercomputer System Annual Report April 2019-March 2020
Report Number: R19EACA31
Subject Category: JSS2 Inter-University Research
- Responsible Representative: Soshi Kawai, Professor, Tohoku University
- Contact Information: Ryo Hirai(hirai@klab.mech.tohoku.ac.jp)
- Members: Soshi Kawai, Ryo Hirai, Yuki Mori
Abstract
LES study of near-wall turbulent physics in heated/cooled-wall compressible turbulent boundary layers is conducted. The study reveals the relation between the mean-velocity profiles and turbulent structures in the conditions with wall heat flux. Also, Further, based on knowledge obtained in the LES study, improved LES wall-model is proposed for the thermal wall-bounded flows.
Reference URL
Please refer to 'Kawai Lab. | Aerospace Engineering, Tohoku University'.
Reasons and benefits of using JAXA Supercomputer System
Especially in the cooled-wall conditions, the Reynolds number based on the wall friction velocity (i.e., inner-layer scaling) becomes high, and high-fidelity LES computations of compressible thermal turbulent boundary layers with cooled wall require significant computational costs. Therefore, a large-scale parallel computation using a supercomputer, such as JSS2, is mandatory.
Achievements of the Year
In this study, the LES analysis of heated/cooled-wall turbulent boundary layers is conducted to investigate the detailed turbulent physics in wall-bounded flows involving wall heat flux. Also, a wall-modeling in LES is improved based on the knowledge obtained by the LES analysis. In this year, the computations of the wall-resolved LES (WRLES) and wall-modeled LES (WMLES) were conducted under the following conditions. The Reynolds number and Mach number of incoming flows are set as Re=5,000 and M=2.28, respectively (the reference length of Re is the momentum thickness of the boundary layer). As the spatial discretization method, the sixth-order compact difference scheme is used. The time integration method is the third-order TVD Runge-Kutta method. In this study, we consider three different heated/cooled wall temperature conditions, Tw/Tr =0.5,1.0,2.0 (where Tr is the recovery temperature). The cooled-wall conditions are the cases of Tw/Tr < 1.0, the heated-wall conditions are the case of Tw/Tr > 1.0, and the quasi-adiabatic-wall condition is the case of Tw/Tr = 1.0.
Figure 1 shows the distributions of (a) transformed mean-velocity considering the density and dynamic viscosity variations [Trettel & Larsson (2015), Patel et al. (2015)] and (b) the viscous stress. Compared to the van Driest transformation usually used for compressible turbulent boundary layers, the velocity scaling law shown in Fig. 1 (a) agrees well among the cases. However, a slight off-set can be seen near the log-layer. In this research, it becomes clear that the off-set in the mean velocity profiles is induced by the viscous stress profiles shown in Fig. 1 (b).
Based on the total shear stress balance in equilibrium flows, the differences in the viscous stress in Fig. 1 also cause the differences in the Reynolds shear stress profiles. Also, the Reynolds shear stress closely relates to turbulent structures, therefore, the turbulent structures are considered to differ between the cases. Figure 2 shows instantaneous stream-wise velocity fluctuations in the inner-layer at y*=15 (y* is the semi-local length scale). Compared to the quasi-adiabatic case (Fig. 2 (a)), smaller structures in the heated case (Fig. 2 (b)), and larger structures in the cooled case (Fig. 2 (c)) are observed. These differences in the turbulent structures suggest the cause of the log-law offset as shown in Fig. 1 (a).
In this study, based on the analysis of the LES flowfields, the improvements of the LES wall-model are achieved by a modification of the length-scale in eddy viscosity approximation. Figure 3 shows the profiles of (a) van Driest transformed velocity and (b) temperature. Good agreements between the improved WMLES and the WRLES are seen in Fig. 3 (a,b). The results suggest that the proposed wall-model works well for flat-plate thermal turbulent boundary layers.
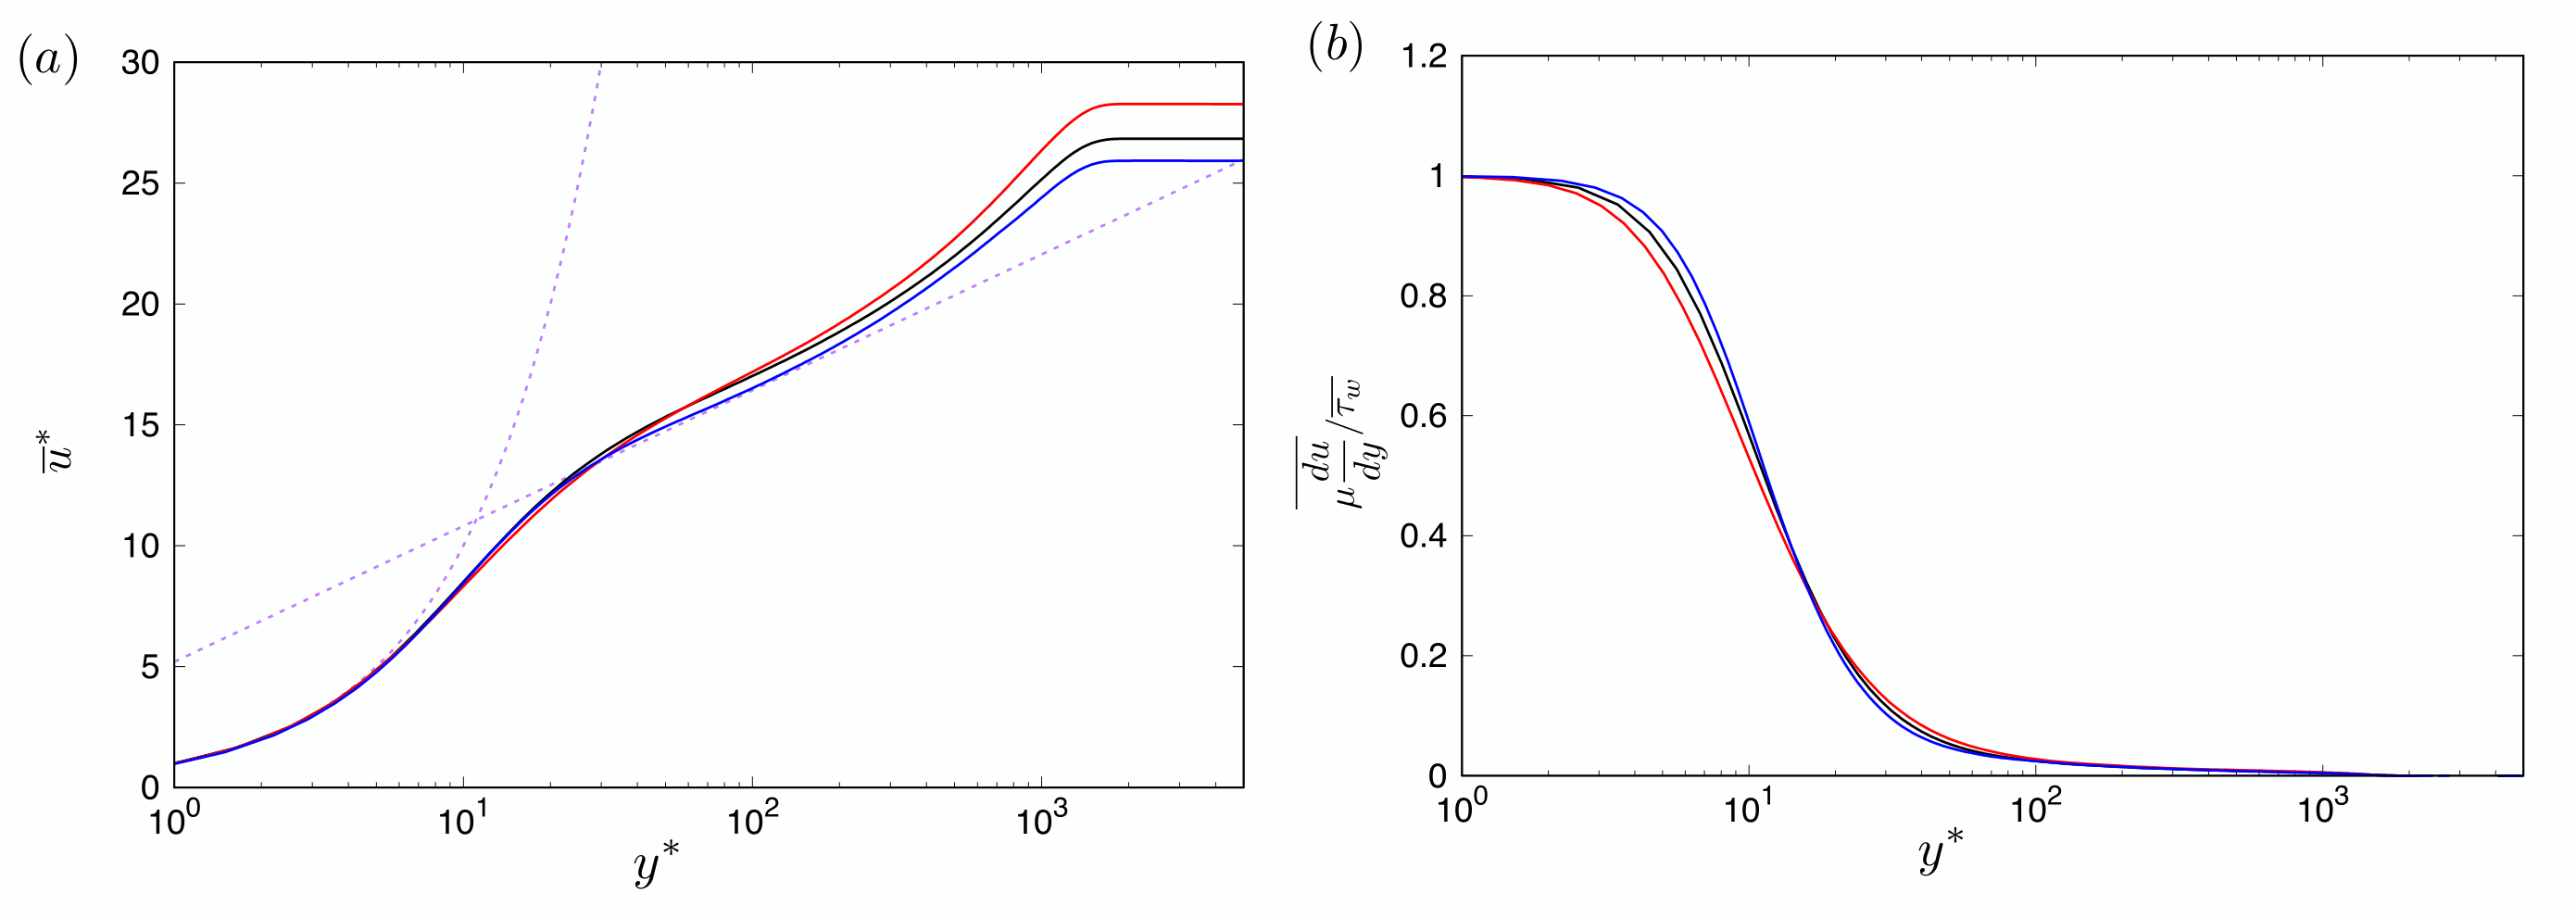
Fig.1: Comparison of thermal turbulent boundary layers with adiabatic/heated/cooled walls. Distributions of (a) transformed mean-velocity considering the density and dynamic viscosity variations [Trettel & Larsson (2015), Patel et al. (2015)] and (b) the viscous stress. Black, quasi-adiabatic; red, heated; blue, cooled; dotted, wall-law.
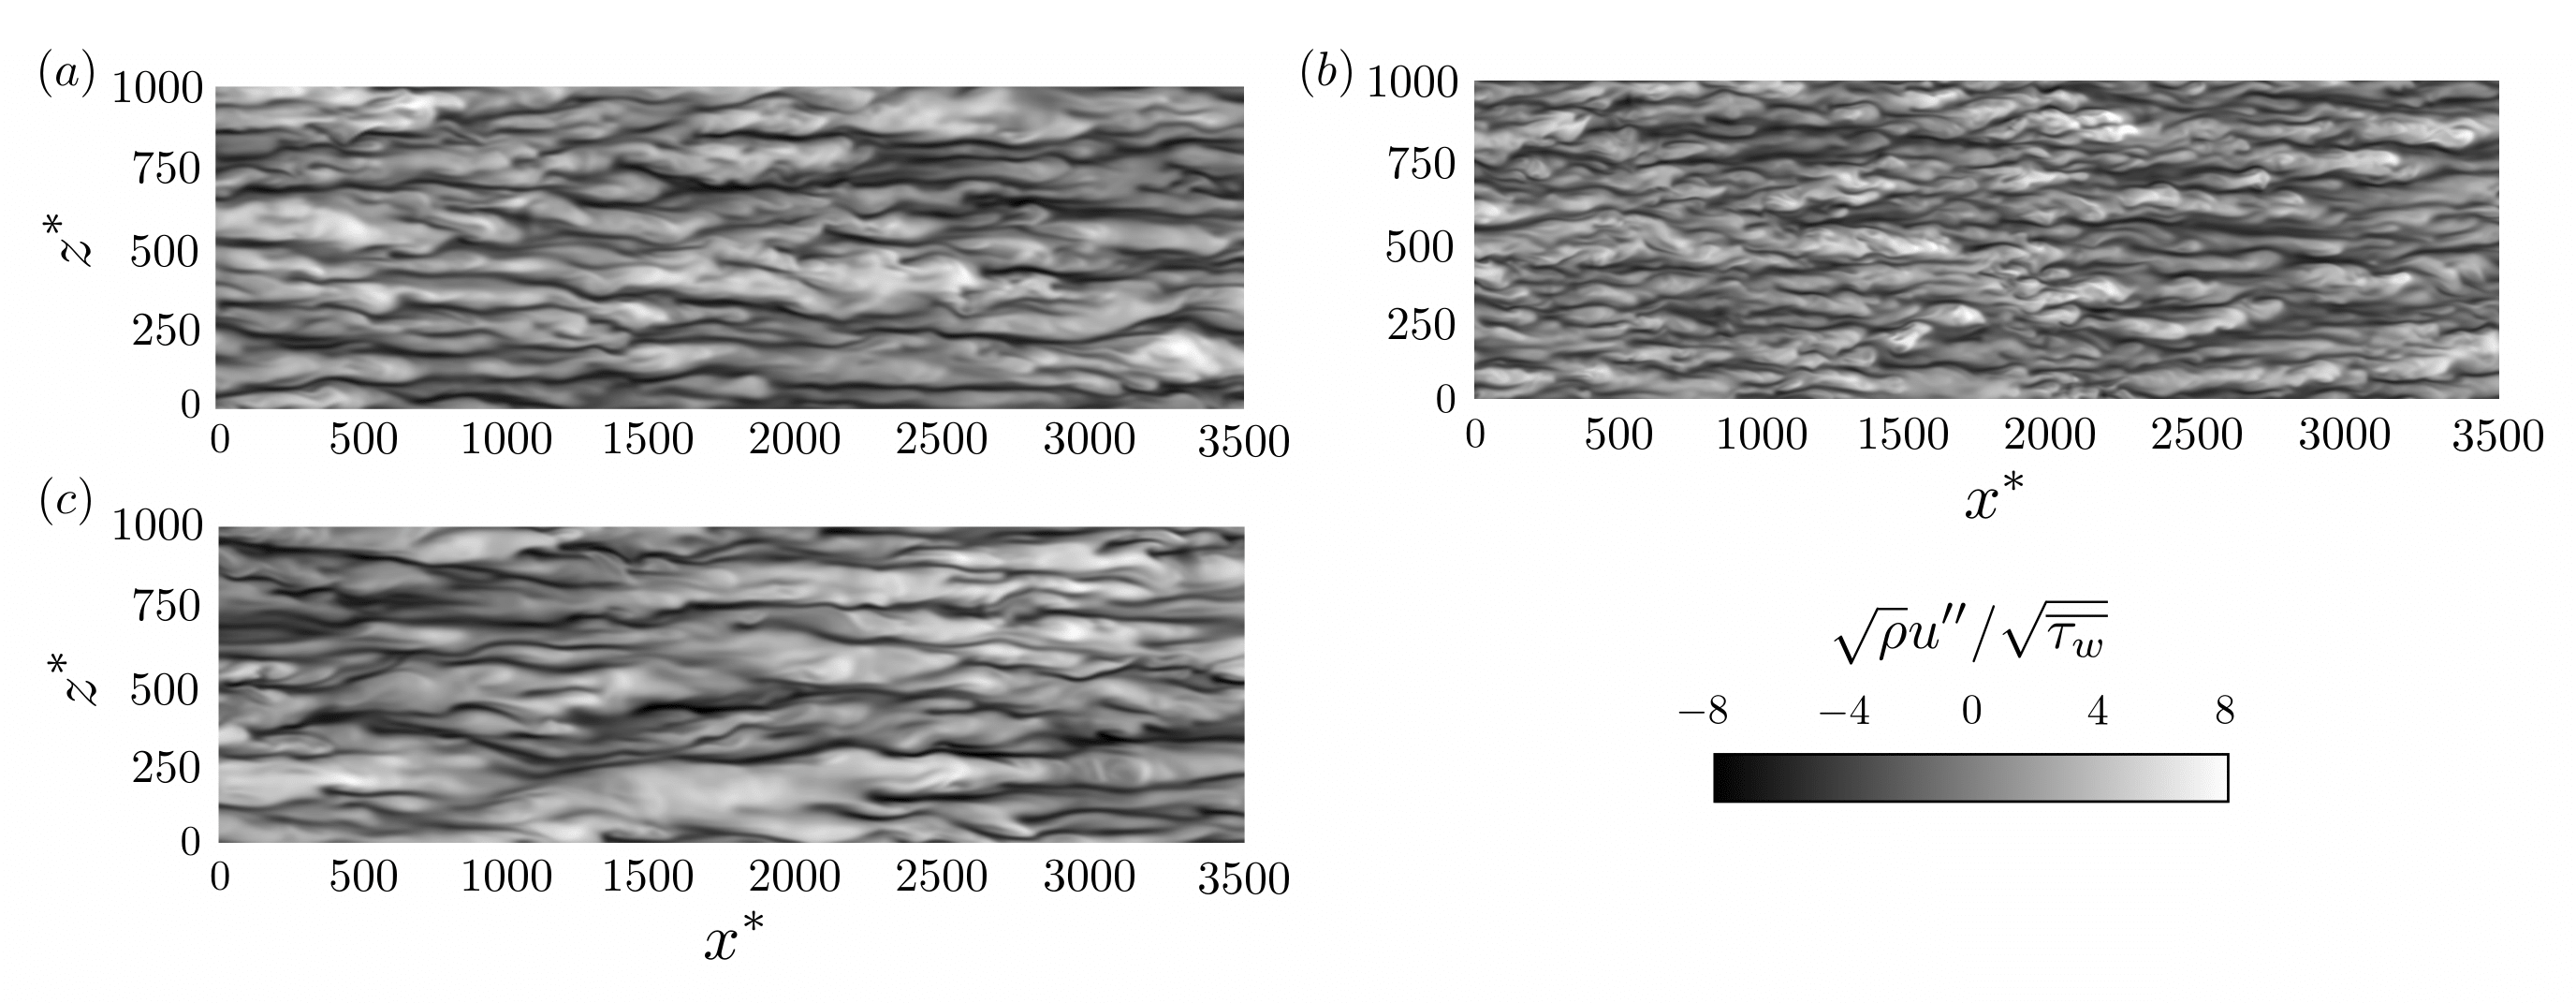
Fig.2: Contours of instantaneous stream-wise velocity fluctuations at y*=15. (a) quasi-adiabatic, (b) heated, (c) cooled.
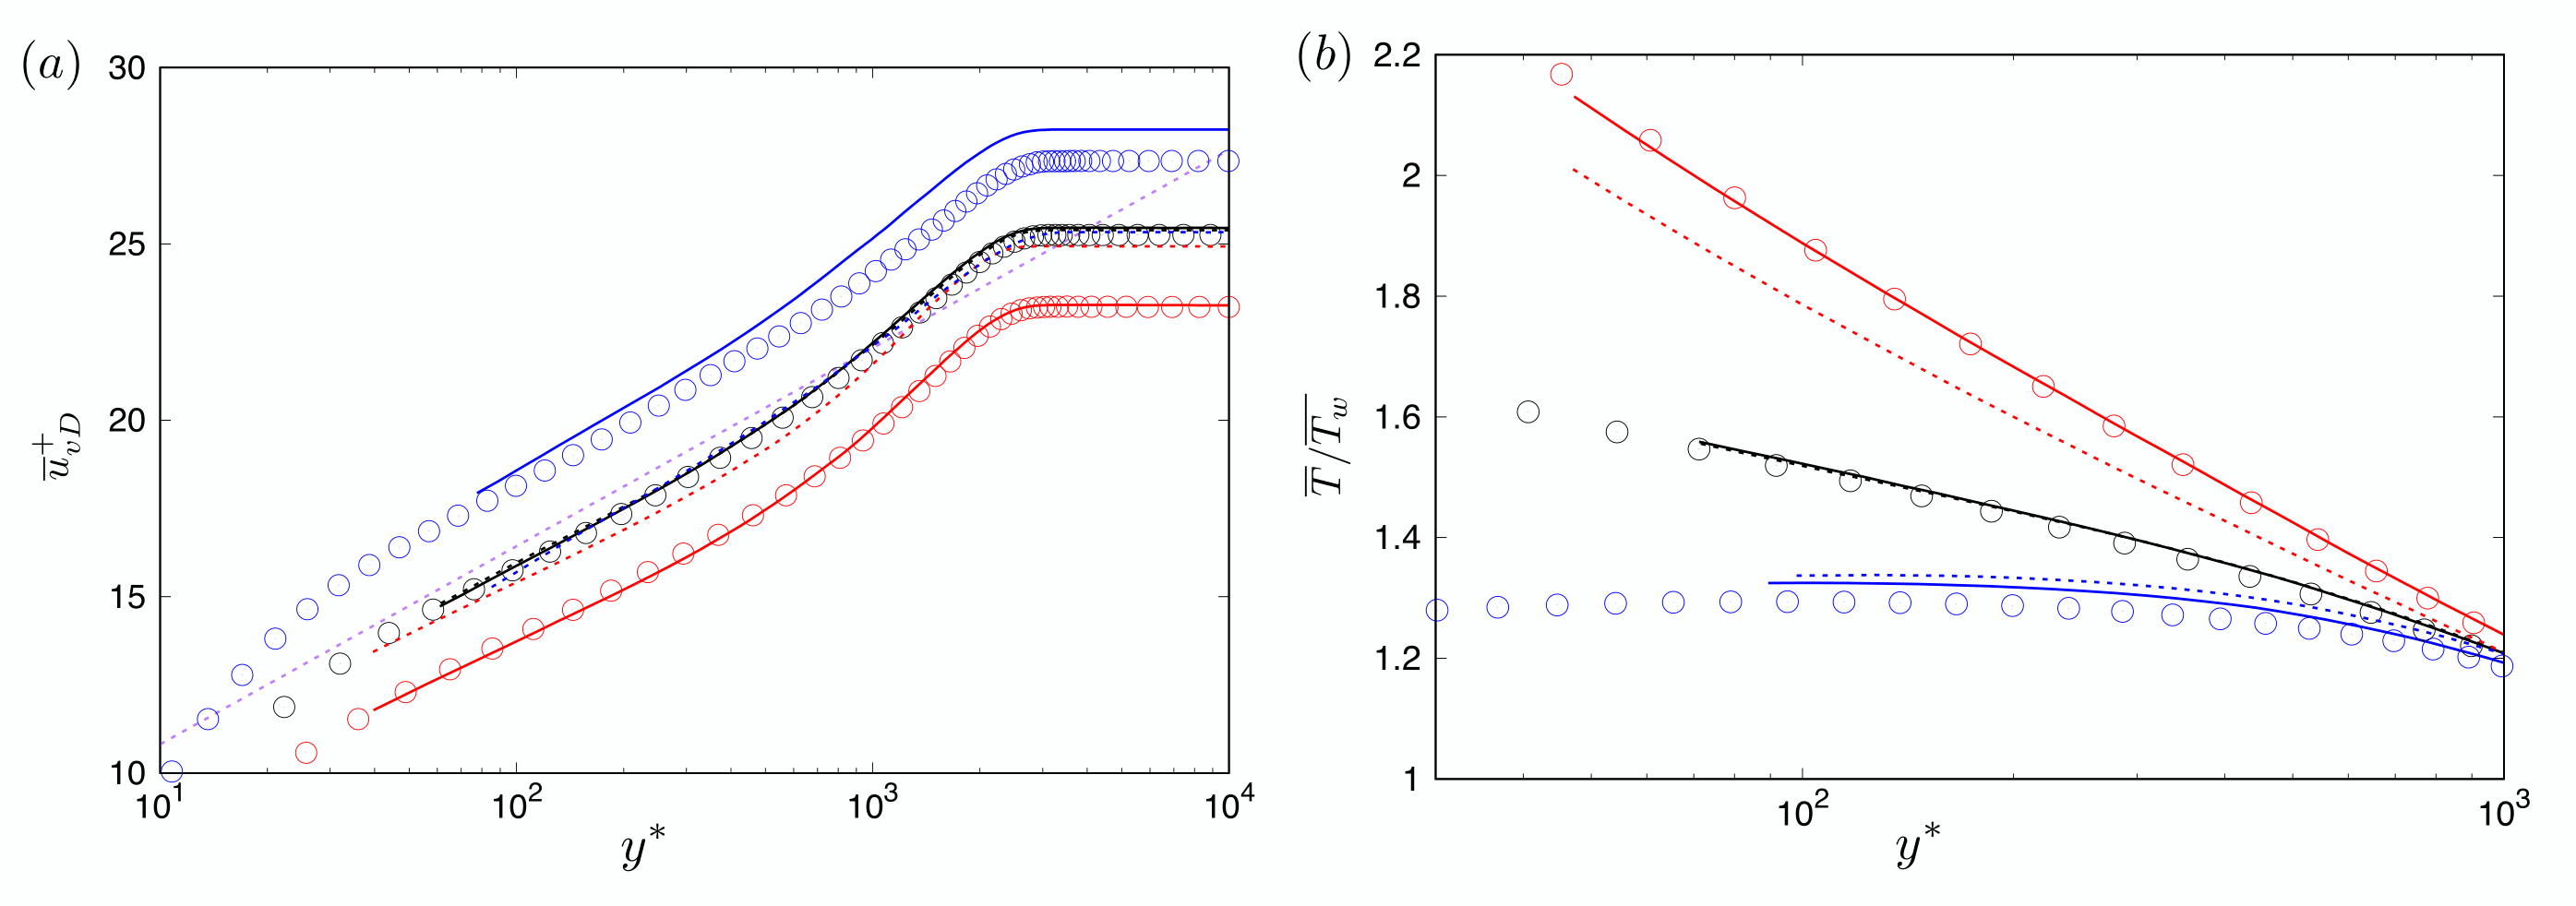
Fig.3: Predicted turbulence statistics in the thermal turbulent boundary layers with adiabatic/heated/cooled walls obtained by the proposed wall model. Distributions of (a) van Driest transformed mean-velocity and (b) mean temperature. Symbol, reference (WRLES); solid, improved WMLES; dashed, conventional WMLES. Black, quasi-adiabatic; red, heated; blue, cooled; dotted, wall-law.
Publications
- Oral Presentations
(1) R. Hirai, S. Kawai, "LES analysis for wall modeling of thermal turbulent boundary layer with wall heat flux", 37th ANSS
(2) R. Hirai, S. Kawai, "Assessment of Wall-Modeled LES for Turbulent Boundary Layers with Heated/Cooled Wall", 72nd Annual Meeting of the APS Division of Fluid Dynamics
Usage of JSS2
Computational Information
- Process Parallelization Methods: MPI
- Thread Parallelization Methods: OpenMP
- Number of Processes: 660 - 1020
- Elapsed Time per Case: 120 Hour(s)
Resources Used
Fraction of Usage in Total Resources*1(%): 0.11
Details
Please refer to System Configuration of JSS2 for the system configuration and major specifications of JSS2.
| System Name | Amount of Core Time(core x hours) | Fraction of Usage*2(%) |
|---|---|---|
| SORA-MA | 976,363.17 | 0.12 |
| SORA-PP | 0.00 | 0.00 |
| SORA-LM | 0.00 | 0.00 |
| SORA-TPP | 0.00 | 0.00 |
| File System Name | Storage Assigned(GiB) | Fraction of Usage*2(%) |
|---|---|---|
| /home | 291.82 | 0.24 |
| /data | 14,657.98 | 0.25 |
| /ltmp | 3,125.00 | 0.27 |
| Archiver Name | Storage Used(TiB) | Fraction of Usage*2(%) |
|---|---|---|
| J-SPACE | 0.00 | 0.00 |
*1: Fraction of Usage in Total Resources: Weighted average of three resource types (Computing, File System, and Archiver).
*2: Fraction of Usage:Percentage of usage relative to each resource used in one year.
JAXA Supercomputer System Annual Report April 2019-March 2020