
Reynolds Number Effect on Aerodynamic Characteristics of Slender Bodies
JAXA Supercomputer System Annual Report April 2019-March 2020
Report Number: R19EACA21
Subject Category: JSS2 Inter-University Research
- Responsible Representative: Keiichi Kitamura, Associate Professor, Yokohama National University
- Contact Information: Hayato Kawashima (Yokohama National University)(kawashima-hayato-rn@ynu.jp)
- Members: Keiichi Kitamura, Hayato Kawashima
Abstract
In order to obtain the drag value of a slender body such as rockets from a wind tunnel test, the base pressure correction and cavity pressure correction are typically required to remove the effect of a sting. The drag greatly depends on the correction method, which requires a careful treatment. Based on this background, in this study, we made a detailed comparison between the wind test results and the numerical calculation results. As a result, it was found that the cavity pressure should be treated as much as the uniform flow static pressure even when strong shock waves occur around the body. It was also found that the base pressure measurement should be performed avoiding the most leeward position where a locally high-pressure occurs; by applying both the corrections, the error can be suppressed to within 1% at an angle of attack of 15 degrees.
Reference URL
N/A
Reasons and benefits of using JAXA Supercomputer System
In this research, there were many calculation cases because we handled various shapes and angles of attack, and the number of grid points was very large because we required high-resolution results. For this reason, we needed to use the supercomputer.
Achievements of the Year
Before investigating the Reynolds number effect of a slender body ( Fig.1 ), first, we investigated the cause of the errors in the drag between the wind tunnel test result and the numerical calculation result in terms of cavity pressure correction and base pressure correction. As a result, in the wind tunnel test of the slender body at a uniform flow Mach number M = 1.3, by treating the cavity pressure as the same level as the uniform flow static pressure, the wind tunnel test results and the numerical calculation results agreed within 1% accuracy in the comparison of the forebody drag at attack angles of 0 to 15 degrees; for example, an error of 13% occurs when assuming vacuum, and 5% when assuming base pressure. In addition, as well as in the wind tunnel test, we tried to calculate the base pressure from the four measurement positions in the numerical calculation solution, and we investigated errors in the base pressure calculation caused by the differences of the measurement positions. As a result, in a wind tunnel test with a general base surface shape such as a circle or a square, by avoiding the location of the most leeward side where a local high pressure region occurs (Fig.2, Fig.3), the drag of the wind tunnel test results and that of the numerical calculation results can be nearly the same with only 1% difference (in the case of angle attacks of 15 degrees).
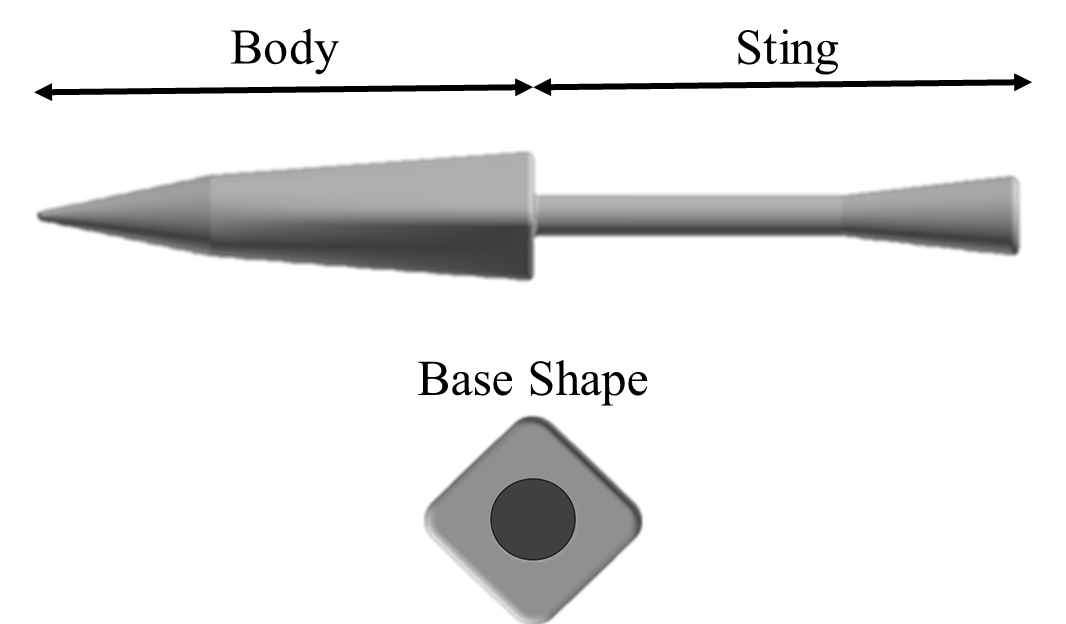
Fig.1: Configuration (the case of square cross section)
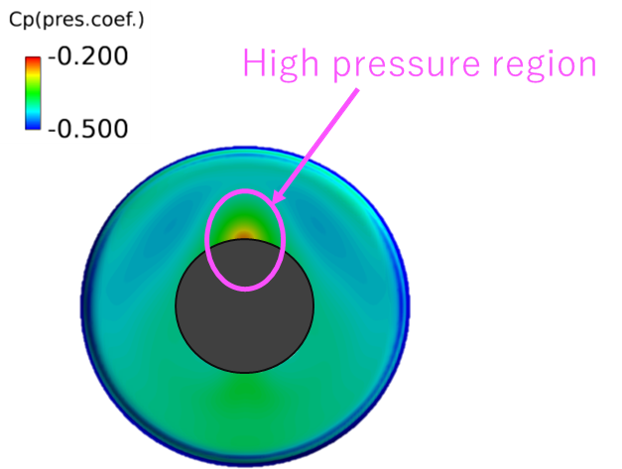
Fig.2: Circle surface pressure distribution at angle of attacks of 15 degreees
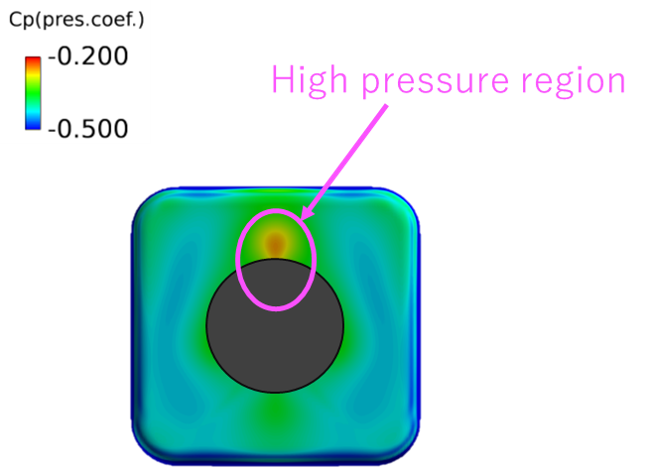
Fig.3: Base surface pressure distribution at angle of attacks of 15 degreees
Publications
- Oral Presentations
1) Hayato Kawashima, Keiichi Kitamura, Satoshi Nonaka, "(1C02)Aerodynamics Analysis of Reusable Rocket in Transonic Flight'', The 50th JSASS Annual Meeting,, Institute of Industrial Science, The University of Tokyo, Japan, April 18, 2019.
2) Hayato Kawashima, Keiichi Kitamura, Satoshi Nonaka, "Study on Correction Method of Base Drag in Transonic Wind Tunnel Test for Slender Body'', Dynamics Symposium of Space Navigation, ISAS, JAXA, Japan, December 9, 2019.
Usage of JSS2
Computational Information
- Process Parallelization Methods: MPI
- Thread Parallelization Methods: N/A
- Number of Processes: 96 - 512
- Elapsed Time per Case: 8 Hour(s)
Resources Used
Fraction of Usage in Total Resources*1(%): 0.03
Details
Please refer to System Configuration of JSS2 for the system configuration and major specifications of JSS2.
| System Name | Amount of Core Time(core x hours) | Fraction of Usage*2(%) |
|---|---|---|
| SORA-MA | 81,633.87 | 0.01 |
| SORA-PP | 16,248.56 | 0.11 |
| SORA-LM | 215.72 | 0.09 |
| SORA-TPP | 0.00 | 0.00 |
| File System Name | Storage Assigned(GiB) | Fraction of Usage*2(%) |
|---|---|---|
| /home | 6.68 | 0.01 |
| /data | 4,787.45 | 0.08 |
| /ltmp | 1,367.19 | 0.12 |
| Archiver Name | Storage Used(TiB) | Fraction of Usage*2(%) |
|---|---|---|
| J-SPACE | 0.00 | 0.00 |
*1: Fraction of Usage in Total Resources: Weighted average of three resource types (Computing, File System, and Archiver).
*2: Fraction of Usage:Percentage of usage relative to each resource used in one year.
JAXA Supercomputer System Annual Report April 2019-March 2020