Laminar-turbulent transition simulation in aFJR High efficiency fan technology development
JAXA Supercomputer System Annual Report April 2019-March 2020
Report Number: R19EA2180
Subject Category: Aeronautical Technology
- Responsible Representative: Tatsuya Ishii, Aeronautical Technology Directorate, Propulsion Research Unit
- Contact Information: Shunji ENOMOTO(enomoto.shunji@jaxa.jp)
- Members: Shunji Enomoto
Abstract
With one of the goals of reducing the fuel consumption of aero engines, the High Efficiency and Lightweight Fan Turbine Technology Demonstration (aFJR) project studied the technologies required to increase the bypass ratio of aero engines. In a high bypass ratio fan, a larger fan rotates at a lower speed than a conventional fan, so that the Reynolds number of the fan flow decreases. By taking advantage of this fact, it is possible to design the laminar flow region of the fan blade surface boundary layer as wide as possible. In this study, we tried to estimate the presence or absence of the transition of the fan blade boundary layer by LES analysis without using a turbulence model or transition model.
Reference URL
Please refer to ‘aFJR (Advanced Fan Jet Research) project | ECAT – Environment-Conscious Aircraft Technology Program | Aeronautical Technology Directorate‘.
Reasons and benefits of using JAXA Supercomputer System
The numerical simulation for predicting the turbulent flow transition is difficult to execute without a supercomputer due to the large amount of calculation.
Achievements of the Year
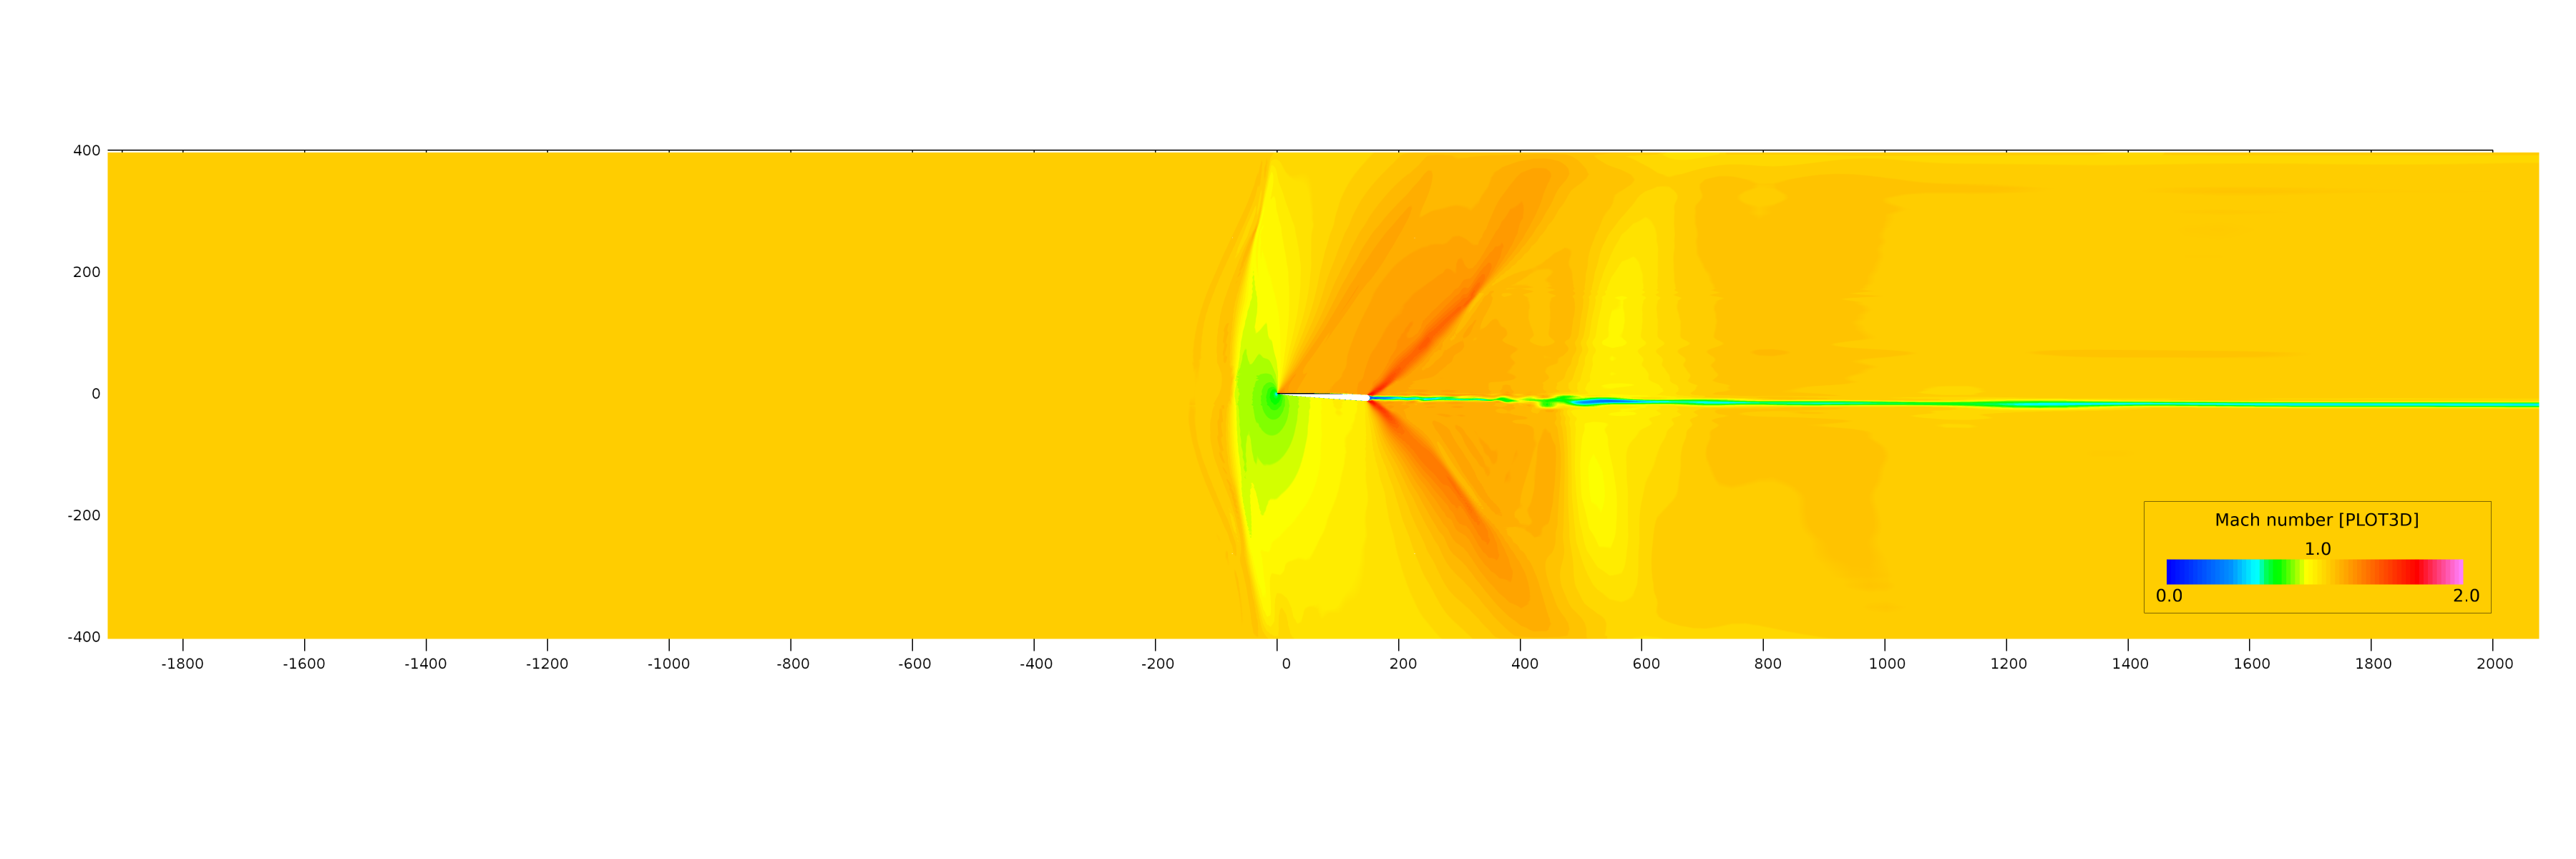
Fig. 1 shows the Mach number distribution of the entire calculation area. The computational grid simulates the shape of the TWT-2 wind tunnel in which the experiment was performed, and the mainstream Mach number is 1.1. A vertical shock wave exists slightly upstream of the fan blade, and the flow flowing into the fan blade is subsonic. Fig.2 shows the instantaneous Mach number distribution. The range of X<25mm is a clean laminar boundary layer without separation, and transition occurs around X=27mm, which is a natural transition. Figure 3 shows the instantaneous value of the v' component of the velocity fluctuation to see what is happening from the leading edge to the transition. A vortex street occurs around X=10mm, grows while traveling in the boundary layer, and reaches a transition at X=27mm. Fig. 4 is a view looking down from 0.02mm above the fan blade surface from above the Y axis. It is doubled in the Z direction. Looking at this figure, oblique waves are generated in the range of 12 < X < 23mm. Since the periodic boundary condition is used in the Z direction, those oblique waves that match the periodic boundary grow selectively. For this reason, it is considered that the width in the Z direction needs to be set to be several times larger than the calculation for accurate calculation.
Fig.2(video): Mach number distribution of wing cross section (5 times enlarged in Y direction)
Fig.3(video): Velocity fluctuation of wing section (v’)
Fig.4(video): Velocity fluctuation at the surface 0.02 mm away from the wing surface (u’) (2 times enlarged in Z direction)
Publications
– Non peer-reviewed papers
Shunji ENOMOTO, Junichi KAZAWA, LES of boundary layer transition of a transonic fan blade, Proceedings of the 33rd symposium on computational fluid dynamics
Usage of JSS2
Computational Information
- Process Parallelization Methods: MPI
- Thread Parallelization Methods: OpenMP
- Number of Processes: 72
- Elapsed Time per Case: 500 Hour(s)
Resources Used
Fraction of Usage in Total Resources*1(%): 0.10
Details
Please refer to System Configuration of JSS2 for the system configuration and major specifications of JSS2.
| System Name | Amount of Core Time(core x hours) | Fraction of Usage*2(%) |
|---|---|---|
| SORA-MA | 0.00 | 0.00 |
| SORA-PP | 39,440.18 | 0.26 |
| SORA-LM | 0.00 | 0.00 |
| SORA-TPP | 130,380.18 | 7.87 |
| File System Name | Storage Assigned(GiB) | Fraction of Usage*2(%) |
|---|---|---|
| /home | 11.05 | 0.01 |
| /data | 3,329.19 | 0.06 |
| /ltmp | 665.84 | 0.06 |
| Archiver Name | Storage Used(TiB) | Fraction of Usage*2(%) |
|---|---|---|
| J-SPACE | 10.48 | 0.26 |
*1: Fraction of Usage in Total Resources: Weighted average of three resource types (Computing, File System, and Archiver).
*2: Fraction of Usage:Percentage of usage relative to each resource used in one year.
JAXA Supercomputer System Annual Report April 2019-March 2020


