Atmospheric Environmental Monitoring Simulation
JAXA Supercomputer System Annual Report April 2018-March 2019
Report Number: R18ER2401
Subject Category: Space Technology
- Responsible Representative: Naoto Matsuura, Director of Earth Observation Research Center
- Contact Information: Maki Kikuchi(kikuchi.maki@jaxa.jp)
- Members: Daisuke Goto, Maki Kikuchi, Kentaroh Suzuki, Tie Dai, Yueming Cheng
Abstract
This project is aimed at development of an integrated system of numerical modeling and satellite observation of air pollution for its reliable monitoring and prediction. For this purpose, seamless atmospheric modeling system is operated on JSS2 to conduct simulations of air pollution transport over East Asia. The results are also validated against satellite observations of aerosols.
Reference URL
N/A
Reasons for using JSS2
In the project, we need to conduct numerical simulations with high spatial resolutions over wide area including Japan and East Asia for reliable monitoring and predictions of air pollutions over the region. This requires us to exploit high performance super computing resources of JSS2 available at JAXA.
Achievements of the Year
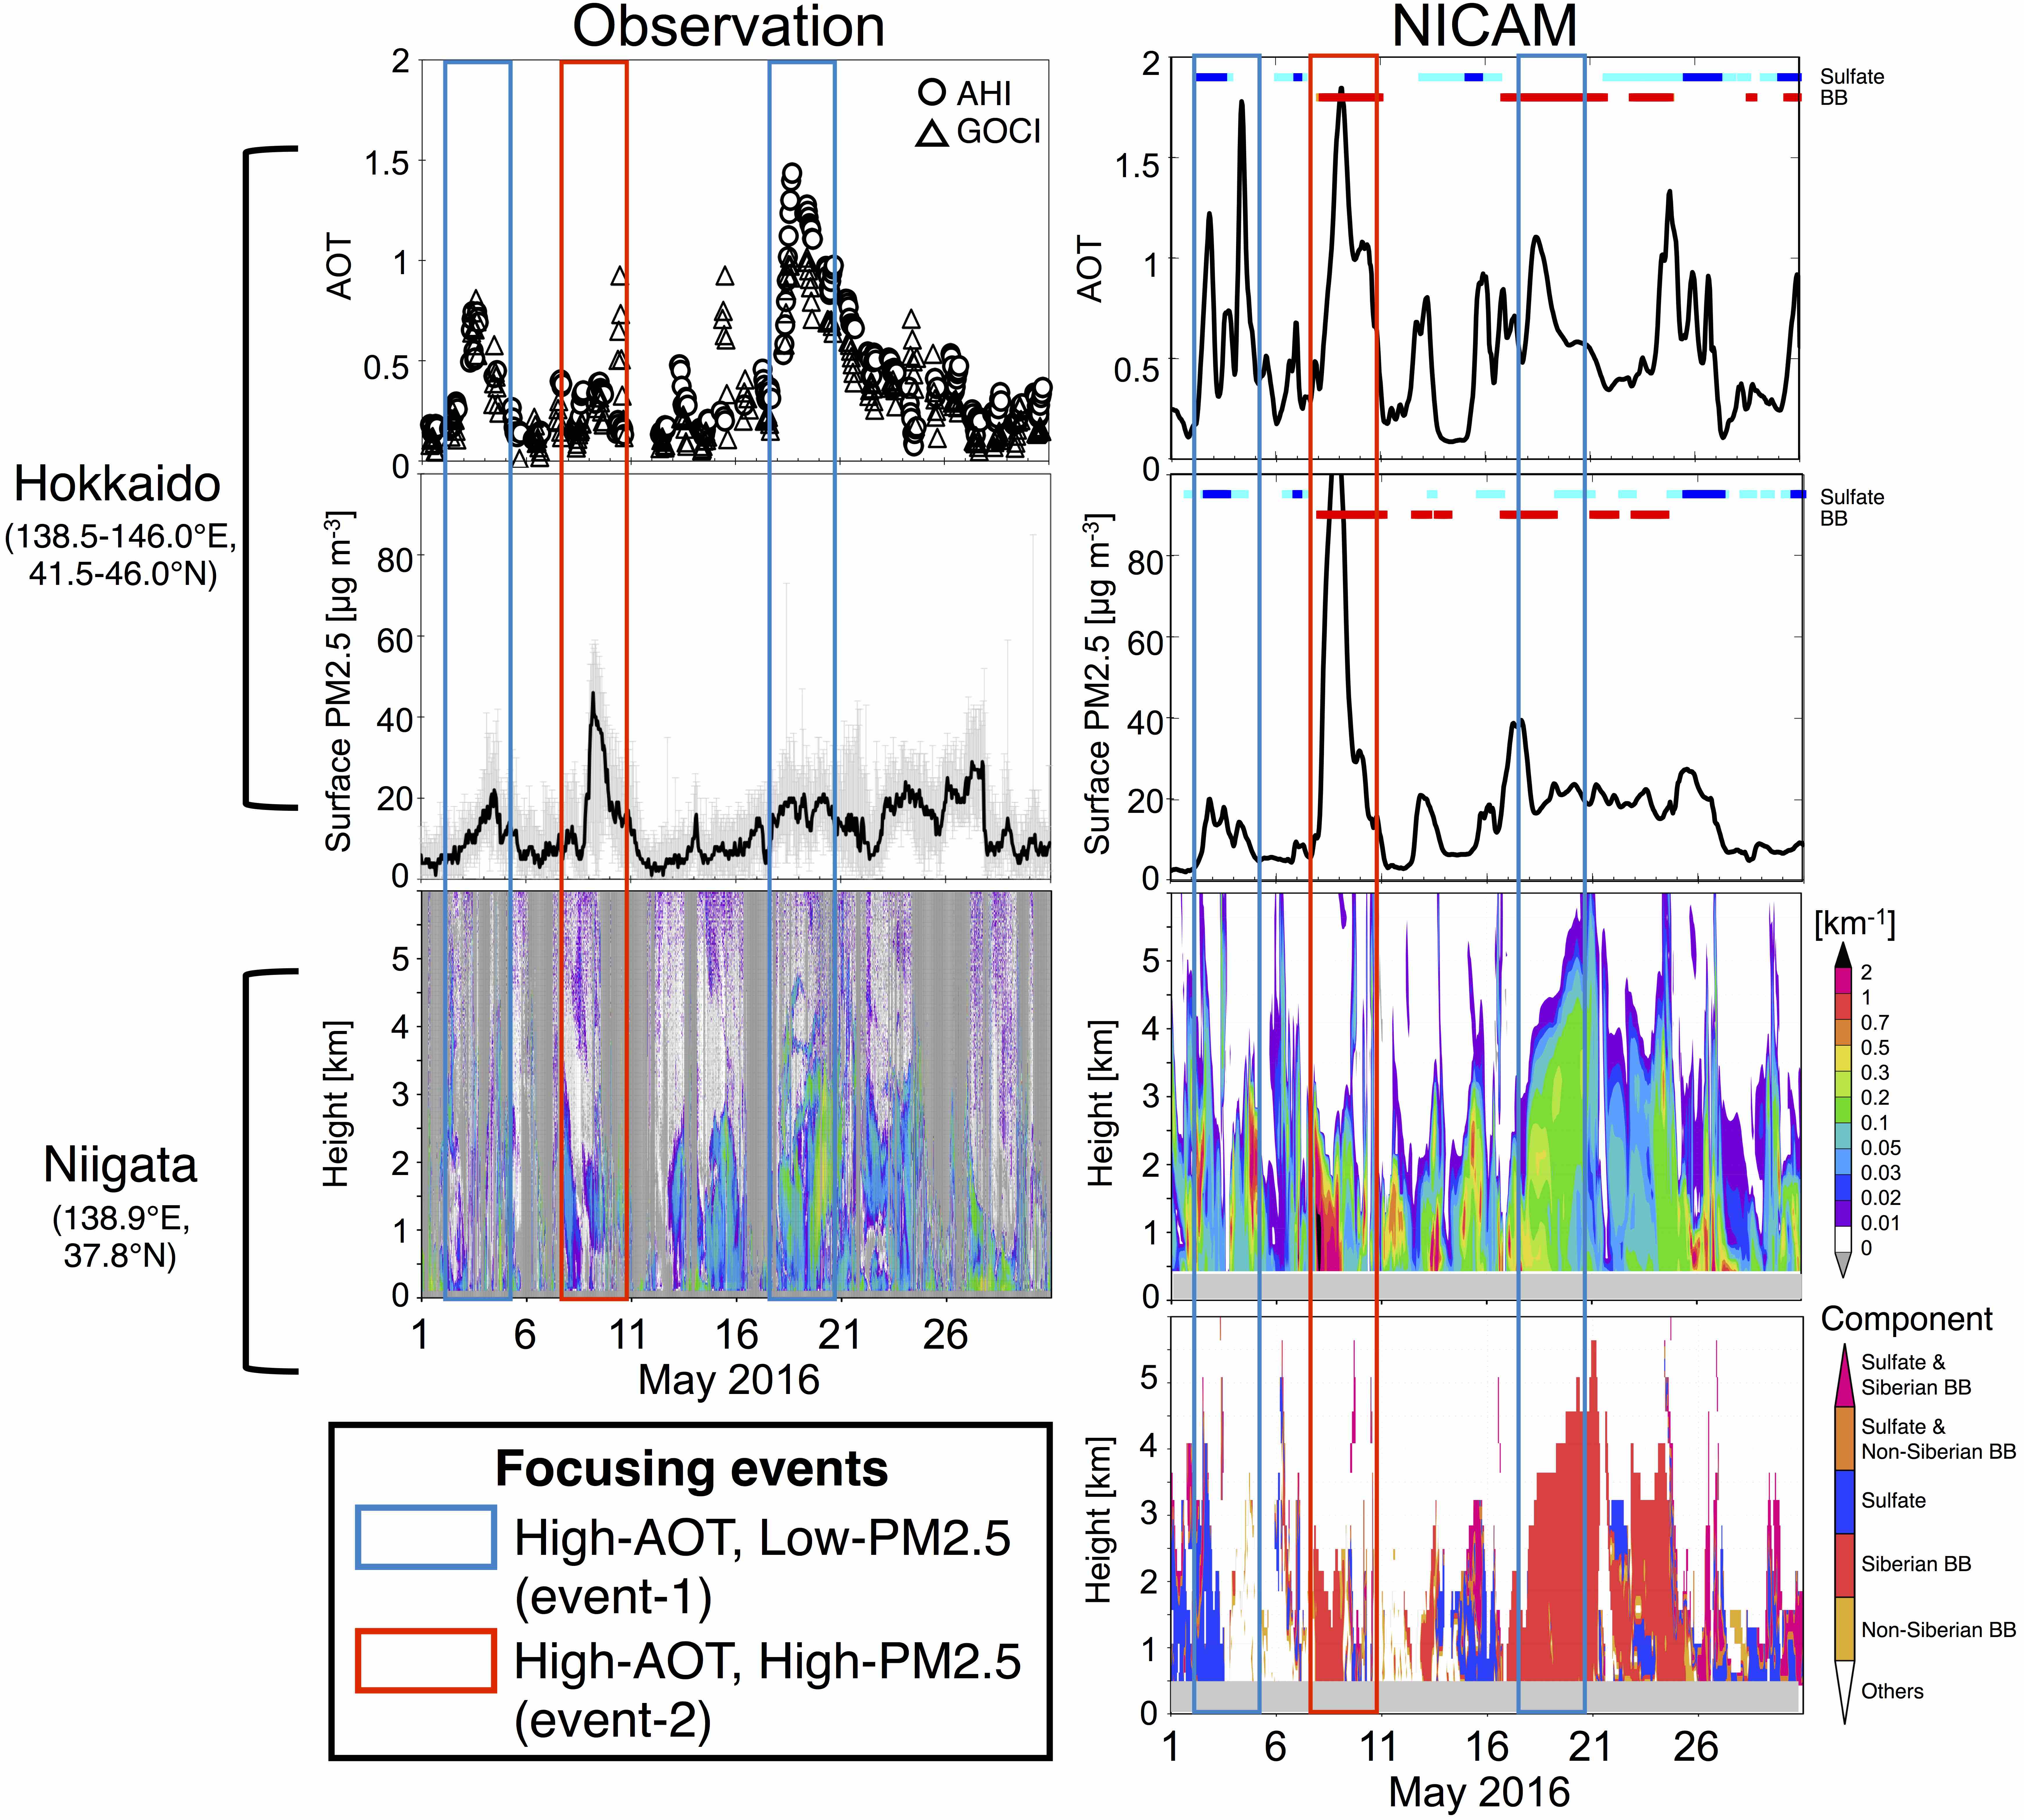
We have continued operations of aerosol simulations with the NICAM-SPRINTARS model installed on JSS2. Regional simulations have been conducted over East Asia area. In this fiscal year, in order to deeply understand the 4-dimensional structure of aerosols over Japan, the simulated results were well validated by multiple measurements such as geostationary satellites of Himawari-8/AHI and COMS/GOCI, in-situ sampling of the surface monitoring under the Atmospheric Environmental Regional Observation System (AEROS) in Ministry of the Environment, Japan, and NIES-lidar network. Figure 1 illustrates an example of the model evaluation in terms of 4-dimensional atmospheric aerosol distributions over Northern Japan. The observed products include aerosol optical thickness (AOT; upper panel), surface PM2.5 concentrations (middle panel) and vertical profile of extinction for spherical aerosols (lower panel). These results show that the model generally reproduced the observed AOT (column amount of aerosols) but sometimes overestimated the observed extinction coefficients (vertical profile of aerosols). Such a comparison enables us to better evaluate the model in the context of its representation of detailed characteristics of aerosol transport processes. This finding shows how to improve the model to better reproduce the realistic distributions of atmospheric aerosols. These results have been published from Goto et al. (2019).
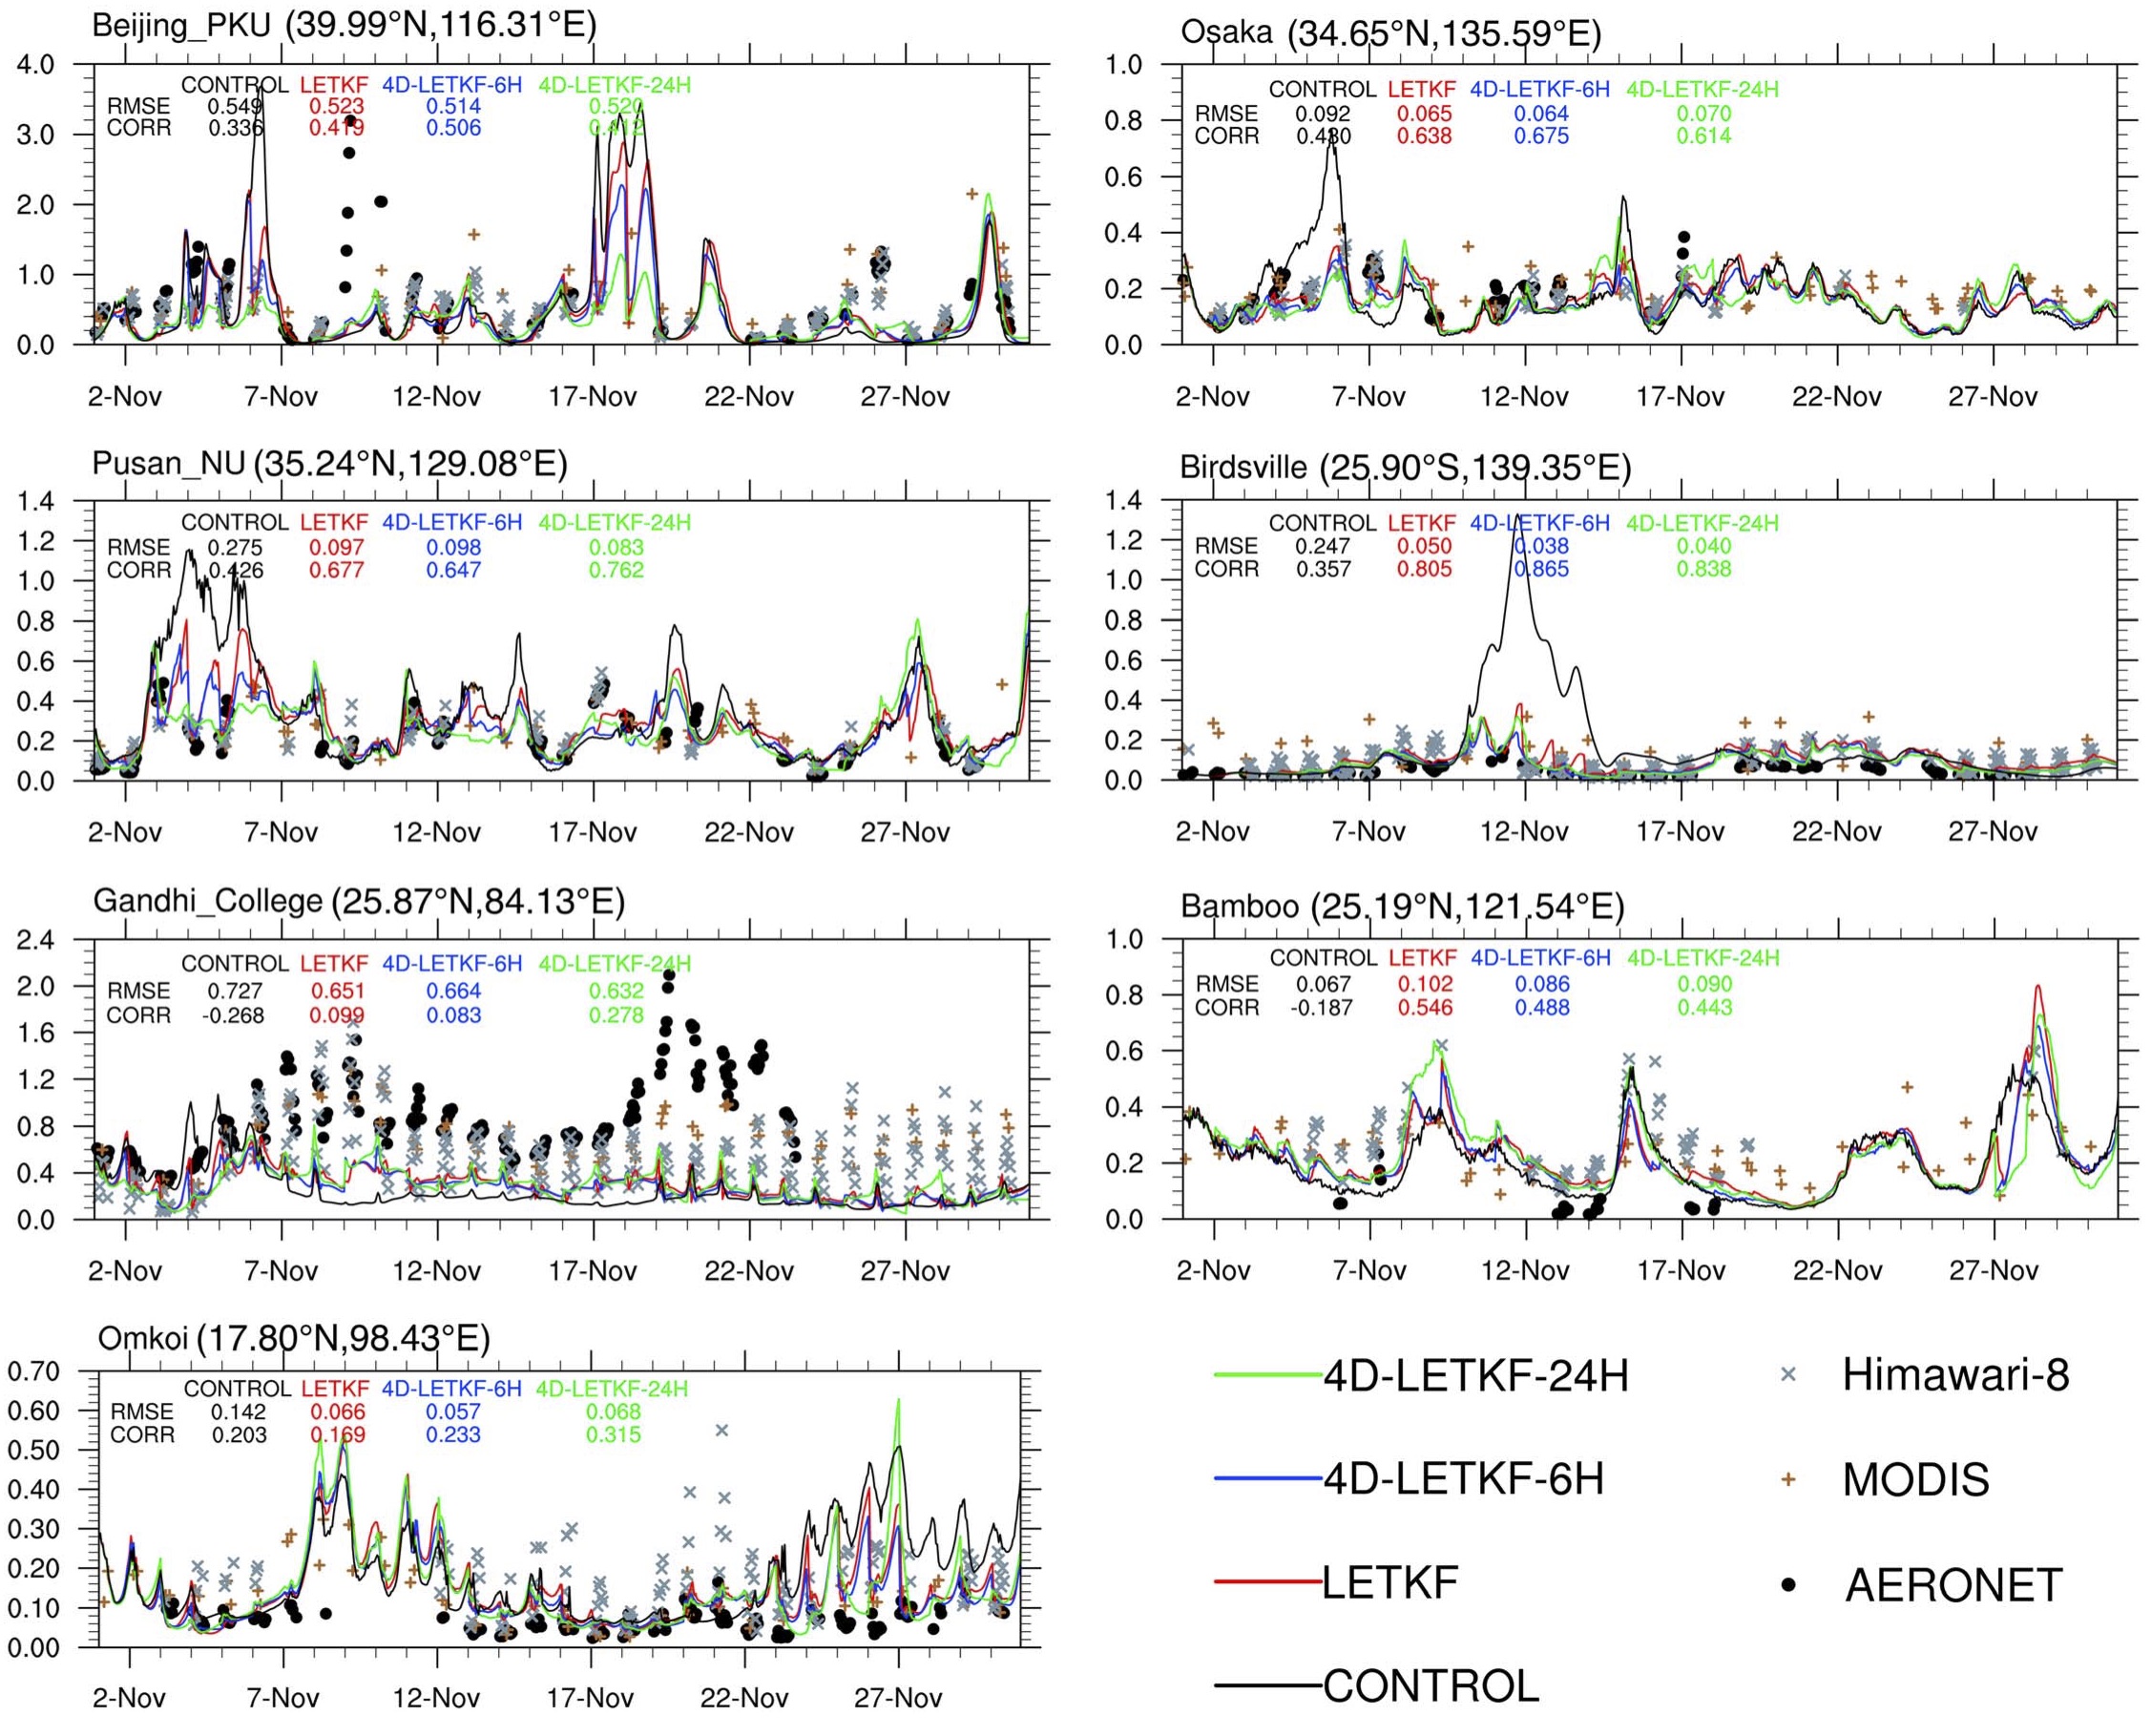
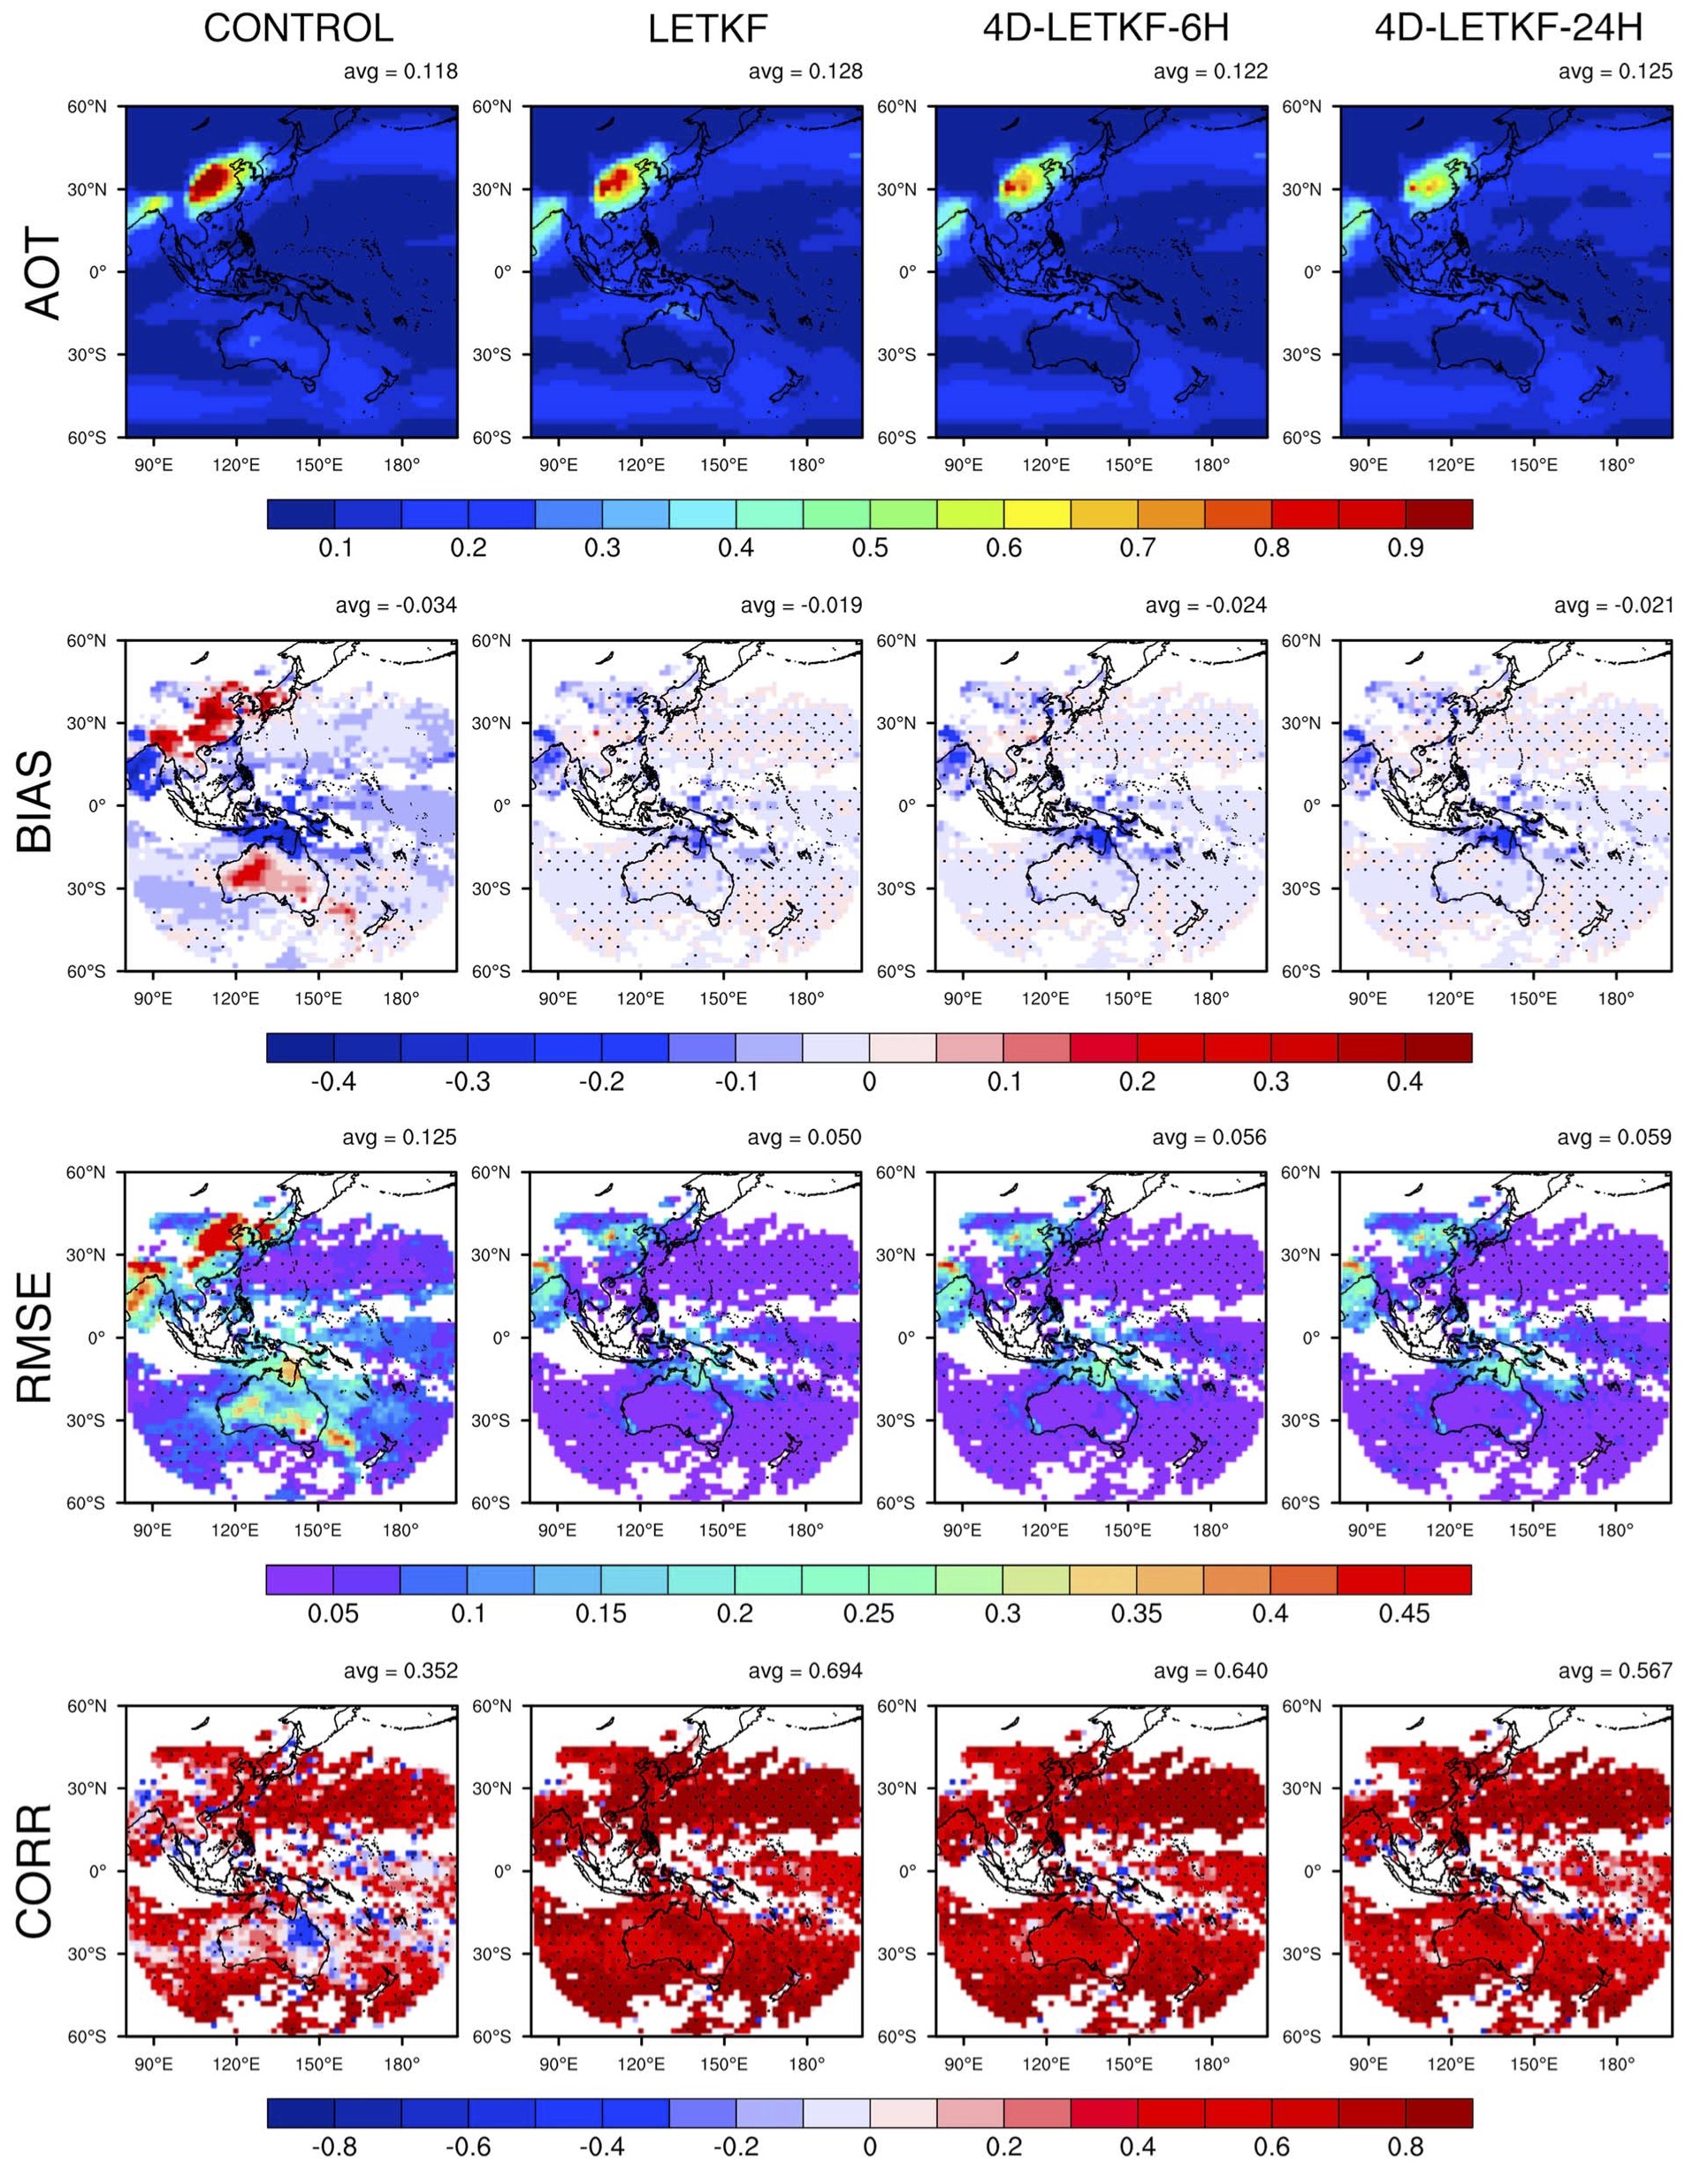
In parallel, we have continued the aerosol assimilation coupled with NICAM-SPRINTARS to better estimate the aerosol transport characteristics over East Asia area by a further developing of the model-satellite synergy. Figure 2 shows that how the simulations with assimilation better represent the time series of aerosol optical thickness at 7 AERONET ground-based measurements, compared to those without assimilation. The statistic metrics obtained from the assimilation were much improved than those obtained from the non-assimilation. In the assimilation results at Osaka as an example, the root-mean-square-error (RMSE) decreases by 20% and the correlation coefficient (CORR) increases by 0.3 compared to the non-assimilation results. Especially, we have confirmed that a new assimilation system of 4-dimensional localized ensemble transform Kalman filter (4D-LETKF) is successfully working on JSS2. Figure 3 also shows the improvement of the assimilation results by comparing independent satellite measurement of MODIS. These results demonstrate how it is unified with Himawari-8 satellite as well as the other satellite measurements through assimilations for better predictions of aerosol pollutions over East Asia area. These results have been published from Dai et al. (2019).

Fig.1: Hourly variations in the AOT, surface PM2.5 concentrations, and extinction coefficients for spherical particles according to multiple measurements (left panels) and as simulated by NICAM (right panels) in northern Japan, including Hokkaido (138.5E-146.0E, 41.5N-46.0N) and Niigata (138.9E, 37.8N). The AOT was retrieved from the Himawari-8/AHI and GOMS/GOCI. The surface PM2.5 concentrations were observed by the Atmospheric Environmental Regional Observation System (AEROS) at Hokkaido. The extinction coefficients were retrieved from NIES-LIDAR. The shaded gray areas in the vertical profiles represent undefined values because of cloud and raindrop contamination and altitude effects. The marks of closed squares in colors around the top in the panels of NICAM-simulated AOT and surface PM2.5 concentrations represent the periods of the high contribution of sulfate in blue (>30% of the total AOT) and in cyan (>50% of the total AOT) to the total AOT and those in the high (>50%) contribution of carbonaceous aerosols in red (for Siberian biomass burning) to the total AOT. The bottom-right panel represents the temporal variation of the major species for the extinction of spherical aerosols obtained by NICAM. The results were defined as those in the high (>50%) contribution of sulfate to the total extinction and those in the high (>50%) contribution of carbonaceous aerosols (Siberian biomass burning, BB, and non-Siberian BB) to the total extinction when the total extinction exceeded 0.02 km-1. This figure is referred from Figure 8 in Goto et al. (2019).

Fig.2: Hourly time series of the simulated aerosol optical thicknesses (AOTs) for the four experiments and the observed AOTs from Himawari-8, Moderate Resolution Imaging Spectroradiometer (MODIS), and AErosol RObotic NETwork (AERONET), over seven selected AERONET sites. The four model experiments include results without assimilation (CONTROL), those with assimilation (LETKF), those with 6-hourly 4-dimentional assimilation (4D-LETKF-6H) and 24-hourly 4-dimentional assimilation (4D-LETKF-24H). The root-mean-square error (RMSE) and correlation coefficient (CORR) between the simulated AOTs for the four experiments and the AERONET observed AOTs are also shown. This figure is referred from Figure 12 in Dai et al. (2019).

Fig.3: Spatial distributions of (first row) the simulated monthly mean aerosol optical thickness (AOT) and the (second row) bias, (third row) root-mean-square error, and (forth row) correlation coefficient between the simulated and Himawari-8 observed AOTs during November 2016 for the four experiments. The term ‘ave’ represents the region-averaged value. Hereafter, the bias is defined as the simulated AOT minus the observed AOT. The points marked by black dots in the second and third rows indicate that the differences in means and variances are not significant at the 95% significance level. The black dots in the fourth row indicate that the correlations are significant at the 95% significance level. This figure is referred from Figure 6 in Dai et al. (2019).
Publications
– Peer-reviewed papers
Dai T., Cheng Y., Zhang P., Shi G., Sekiguchi M., Suzuki K., Goto D., Nakajima T. (2018) Impacts of meteorological nudging on the global dust cycle simulated by NICAM coupled with an aerosol model. Atmospheric Environment, 190, 99-115, doi:10.1016/j.atmosenv.2018.07.016
Goto D., Kikuchi M., Suzuki K., Hayasaki M., Yoshida M., Nagao T.M., Choi M., Kim J., Sugimoto N., Shimizu A., Oikawa E., Nakajima T. (2019) Aerosol model evaluation using two geostationary satellites over East Asia in May 2016. Atmospheric Research, 217, 93-113, doi:10.1016/j.atmosres.2018.10.016
Dai T., Cheng Y., Suzuki K., Goto D., Kikuchi M., Schutgens N.A.J., Yoshida M., Zhang P., Husi L., Shi G., Nakajima T. (2019) Hourly aerosol assimilation of Himawari-8 AOT using the four-dimensional local ensemble transform Kalman filter. Journal of Advances in Modeling Earth Systems, https://doi.org/10.1029/2018MS001475.
– Oral Presentations
Goto D., Kikuchi M., Suzuki K., Hayasaki M., Yoshida M., Nagao T., Sugimoto N., Shimizu A., Nakajima T. (2018) Understanding of Atmospheric Aerosol Behavior Using a Semi-Regional Model, a Geostationary Satellite and in Situ Measurements over Japan in May 2016, 15th Annual Meeting: Asia Oceania Geosciences Society (AOGS), Honolulu, Hawaii, USA, June 2018
Goto D. (2018) Analysis of aerosol transport to Japan by combining seamless regional model and multiple observations including geostationary satellite: A case study of May 2016, Land Cover/Land Use Changes (LC/LUC) and Impacts on Environment in South/Southeast Asia -International Regional Science Meeting, Manila, Philippine, May 2018
Usage of JSS2
Computational Information
- Process Parallelization Methods: MPI
- Thread Parallelization Methods: Automatic Parallelization
- Number of Processes: 1 – 160
- Elapsed Time per Case: 20 Hour(s)
Resources Used
Fraction of Usage in Total Resources*1(%): 0.04
Details
Please refer to System Configuration of JSS2 for the system configuration and major specifications of JSS2.
| System Name | Amount of Core Time(core x hours) | Fraction of Usage*2(%) |
|---|---|---|
| SORA-MA | 27,369.32 | 0.00 |
| SORA-PP | 0.00 | 0.00 |
| SORA-LM | 0.00 | 0.00 |
| SORA-TPP | 0.00 | 0.00 |
| File System Name | Storage Assigned(GiB) | Fraction of Usage*2(%) |
|---|---|---|
| /home | 1,645.09 | 1.70 |
| /data | 39,920.83 | 0.70 |
| /ltmp | 12,695.32 | 1.09 |
| Archiver Name | Storage Used(TiB) | Fraction of Usage*2(%) |
|---|---|---|
| J-SPACE | 0.00 | 0.00 |
*1: Fraction of Usage in Total Resources: Weighted average of three resource types (Computing, File System, and Archiver).
*2: Fraction of Usage:Percentage of usage relative to each resource used in one year.
JAXA Supercomputer System Annual Report April 2018-March 2019


