
Study on development of satellite-based ocean data assimilation system
JAXA Supercomputer System Annual Report April 2017-March 2018
Report Number: R17ER2402
Subject Category: Space Technology
- Responsible Representative: Teruyuki Nakajima, Space Technology Directrate I, Earth Observation Research Center
- Contact Information: Misako Kachi kachi.misako@jaxa.jp
- Members: Misako Kachi, Tsutomu Hihara, Hidenori Aiki, Yasumasa Miyazawa, Shun Ohishi
Abstract
To enable satellite information ore familiar and easy to utilize, we develop "ocean forecast" without missing area by using the ocean model and data assimilation system with the highest spatial resolution (about 3km) in Japan to utilize satellite-based ocean, snow and ice products produced by JAXA at the maximum. At the same time, we promote studies on climate variations, with a focus on polar region, to improve accuracy of prediction of global warming and evaluation of its impacts.
Reference URL
Please refer to 'Ocean Environment Monitoring | Earth Observation Priority Research | JAXA Earth Observation Research Center (EORC)'.
Reasons for using JSS2
The data assimilation system and model cannot execute in Linux computers generally used at EORC, since the regional ocean models are high spatial resolution (3km), satellite data is assimilated to the system daily, and forecast three-dimensional ocean physical parameters about 10-80 days in future. Therefore, we need super computer to do this study.
Achievements of the Year
In JFY2017, we had installed the satellite sea surface temperature (SST) data assimilation system and the 3-km high-resolution ocean model over the south of Japan, which was developed by JAXA and JAMSTEC, and constructed the system for operation on JSS2. In this fiscal year, we implemented experiments to assimilate several satellite SSTs, AMSR2 on GCOM-W, AHI on Himawari-8, and MODIS on Aqua and Terra, with 20 ensemble members to calculate variation of the Kuroshio Current at the sea surface and undersea over the south of Japan. Fig. 1 shows impacts of each SST to results of data assimilation. Different seasonal biases in each satellite SST (MODIS has negative bias in summer, Himawari-8 has positive bias in summer, and AMSR2 is neutral over the year) used in data assimilation have influenced to model simulated sea temperature profiles in summer. To avoid this impact, we improved the system to reduce biases between satellite SSTs just before data assimilation.
Furthermore, we developed movies to show temporal variation of the Kuroshio Current and its large meander, which has started since the end of September 2017, under collaboration with JAXA Supercomputer Division. Fig.2 shows daily ocean variation over the south of Japan from August to September 2017, and ocean current is shown in vector and strong current area is denoted by color. Large meander of the Kuroshio in the end of September is clearly seen in the south of Kanto area.
We also applied this 3km resolution ocean model and data assimilation system to the area around Thailand Bay under collaboration with Nagoya University. We also installed a coarse (1/12 degree) resolution extensive ocean model over the Western Pacific region to provide boundary conditions to the 3km resolution model and started research to use simulation results to respond issues of environment and disasters in the Asia-Oceania region. Fig.3 is animation of Thailand Bay area with 3km resolution model SST assimilated satellite SSTs (left) and 2km resolution Himawari-8 SST (right). Upwelling (low temperature indicated by blue color) around the east coast of Indochina Peninsula can be demonstrated by model output.
Promotion of satellite data assimilation to model will provide continuous ocean environmental dataset without missing by satellite observations and/or including geophysical parameters that cannot be observed from satellites directly. We expect to utilize the dataset to ocean environmental monitoring, fisheries, and ship navigations.
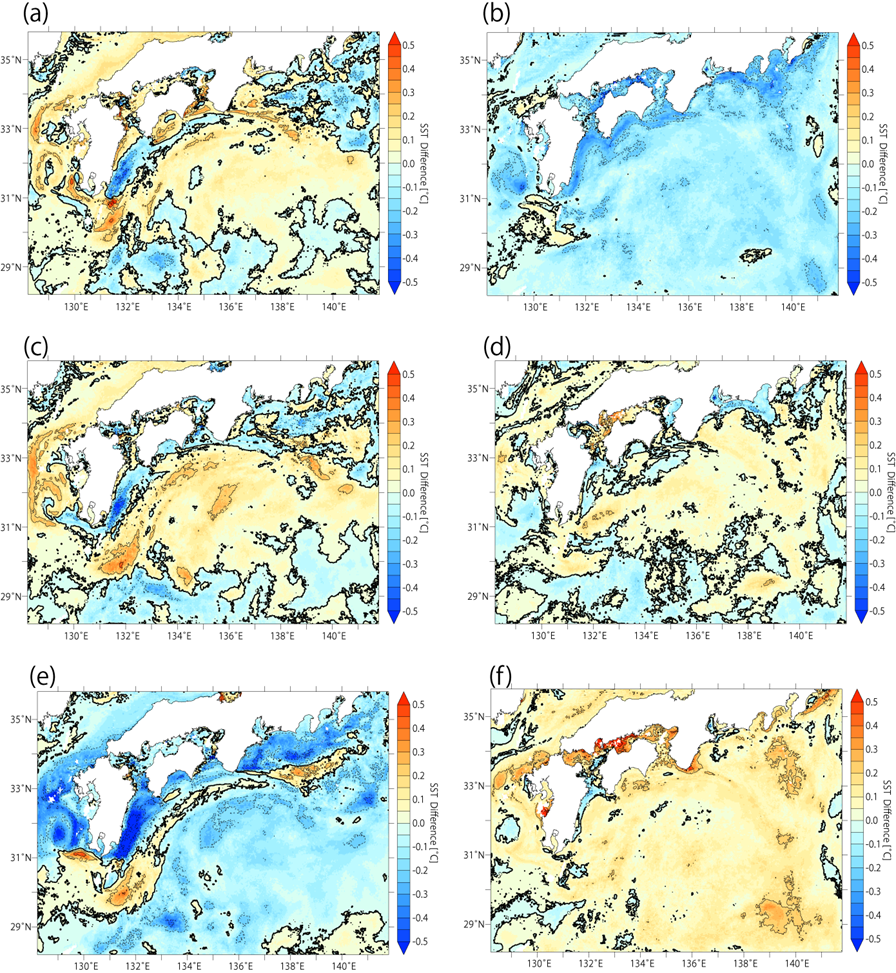
Fig.1: Differences caused by different satellite-based sea surface data. (a) Impact of MODIS in Jan-Apr. 2017, (b) same as (a) but in May-Aug. 2016, (c) impact of AMSR2 in Jan.-Apr. 2017, (d) same as (c) but in May-Aug. 2016, (e) impact of Himawari-8 in Jan.-Apr
Fig.2(video): Simulation of daily ocean variation over the south of Japan from Aug. to Sep. 2017.
Fig.3(video): Movie of sea surface temperature by ocean model (left) and satellite (right) around Thailand Bay in Aug. 2015.
Publications
■ Peer-reviewed papers
1) Miyazawa, Y., S. M. Varlamov, T. Miyama, X. Guo, T. Hihara, K. Kiyomatsu, M. Kachi, Y. Kurihara, H. Murakami, "Assimilation of high-resolution sea surface temperature data into an operational nowcast/forecast system around Japan using a multi-scale three dimensional variational scheme", Ocean Dynamics, 67, 713-728, 2017.
■ Presentations
1) Hihara, H., Y. Miyazawa, T. Miyama, M. Kachi, H. Murakami, Y. Kurihara, N. Ono, H. Aiki, "Constructing an ocean data assimilation product using satellite sea surface temperature", JpGU, Makuhari, Japan, May 2017.
2) Hihara, H., Y. Miyazawa, T. Miyama, M. Kachi, H. Murakami, Y. Kurihara, N. Ono, H. Aiki, "Constructing an ocean data assimilation product using satellite sea surface temperature", 18-th International GHRSST Science Team Meeting, Qingdao, China, June 2017.
3) Kachi, M., H. Murakami, M. Kikuchi, T. Kubota, R. Oki, T. Nakajima, "Current and Future Status of the JAXA's Missions and Earth Observation Priority Researches", EUMETSAT Meteorological Satellite Users Conference 2017, Rome, Oct. 2017.
4) Kachi, M., M. Kikuchi, T. Kubota, R. Oki, M. Hori, H. Murakami, T. Nakajima, "JAXA Himawari Monitor and its Synergies to Earth Observation Missions", 8th Asia Oceania Meteorological Satellite Users Conference, Vladivostok, Oct. 2017.
5) Hihara, H., Y. Miyazawa, T. Miyama, M. Kachi, H. Murakami, Y. Kurihara, "Ocean data assimilation experiments using high resolution satellite sea surface temperature around Japan", 2018 Ocean Sciences Meeting, Portland, US, Feb. 2018.
6) Ohishi, S., T. Hihara, H. Aiki, J. Ishizaka, Y. Miyazawa, M. Kachi, "Investigation of Himawari-8 SSTs for oceanic data assimilation off Thailand/Vietnam", 2018 Ocean Sciences Meeting, Portland, USA, Feb. 2018.
Usage of JSS2
Computational Information
- Process Parallelization Methods: MPI
- Thread Parallelization Methods: Automatic Parallelizatio
- Number of Processes: 20 - 32
- Elapsed Time per Case: 50.00 minutes
Resources Used
Fraction of Usage in Total Resources*1(%): 0.72
Details
Please refer to System Configuration of JSS2 for the system configuration and major specifications of JSS2.
| System Name | Amount of Core Time(core x hours) | Fraction of Usage*2(%) |
|---|---|---|
| SORA-MA | 5,534,231.01 | 0.74 |
| SORA-PP | 0.00 | 0.00 |
| SORA-LM | 0.00 | 0.00 |
| SORA-TPP | 0.00 | 0.00 |
| File System Name | Storage Assigned(GiB) | Fraction of Usage*2(%) |
|---|---|---|
| /home | 042.92 | 0.03 |
| /data | 83,866.16 | 1.55 |
| /ltmp | 8,789.07 | 0.66 |
| Archiver Name | Storage Used(TiB) | Fraction of Usage*2(%) |
|---|---|---|
| J-SPACE | 0.00 | 0.00 |
*1: Fraction of Usage in Total Resources: Weighted average of three resource types (Computing, File System, and Archiver).
*2: Fraction of Usage:Percentage of usage relative to each resource used in one year.
JAXA Supercomputer System Annual Report April 2017-March 2018