
Greenhouse gases Observing SATellite (GOSAT) mission
JAXA Supercomputer System Annual Report April 2017-March 2018
Report Number: R17ER2100
Subject Category: Space Technology
- Responsible Representative: Masakatsu Nakajima, Space Technology Directorate I, GOSAT-2 Project Team
- Contact Information: Yoko UEDA ueda.yoko@jaxa.jp
- Members: Makiko Hashimoto, Kenji Kowata, Hideki Suetake, Hisanori Tanaka, Yuuji Shinotsuka, Hiroshi Suto, Makoto Imanaka, Yoshifumi Yamamoto, Akiko Otomo, Yoko Ueda, Tomoo Yamasaki, Shigeru Iguchi, Takashi Goto, Hidetoshi Hayasaka, Mamoru Sugawara
Abstract
GOSAT observe carbon dioxide and methane - two major green-house effect gasses - from space, then we obtain better understanding in the science of behavior of these gasses. The knowledge serves as a basis for devising global warming countermeasure means.
Reference URL
Please refer to 'HOME - GOSAT - JAXA'.
Reasons for using JSS2
GOSAT mission utilizes JSS2 as one of the GOSAT Mission Operation System which processes the observation data of GOSAT. When processing algorithm is updated, JSS2 reprocesses all data observed in the past. When we calibrate products, JSS2 processes all data in the past. Also, JSS2 is used as a remote storage of all data required for its reprocessing.
As the reprocessing targets of GOSAT products extends to all data observed in the past, more computer resources (core, memory, storage, etc.) are required than in the real-time processing.
It is necessary to use JSS2 to shorten the reprocessing time and to provide the reprocessing products to GOSAT users more quickly.
Achievements of the Year
(1)GOSAT TANSO-FTS Level-1 Reprocessing
We reprocessed 7 year TANSO-FTS data by utilizing JSS2 (30nodes) to correspond with next version-up evaluation sample (V204204,V205205). It took only 20 days, and we could verify speed-up more than 30 times comparing to one year by using the conventional GOSAT L1 processing computers.
(2)Calibration and validation of GOSAT TANSO-CAI data
On-orbit sensor sensitivity change is evaluated from TANSO-CAI observation data. We expect to determine the CAI Band 1 radiometric calibration factor (or formula) by calculation of radiative transfer model using in-situ and other satellite data. The CAI Band 1 has an important information of aerosol size distribution. Hence, Band 1 radiance is optimized to agree with calibrated radiances of Band 2 and Band 3. Calibration formula of Band 2 and Band 3 are obtained as three candidates. Thus, Band 1 calibration factor is determined by calculations in these three cases. Figure 1 shows a schematic flow of the CAI radiometric calibration method. Figure 2 shows the radiometric calibration factors.
Data period: June 2017 - February 2018 (every 4 months)
(3) Research processing of GOSAT TANSO-FTS thermal infra-red data
Level 2 algorithm is improved for utilization of TANSO-FTS thermal infra-red (TIR) data. After implementation of TIR Level 2 programs to JSS-2 system and re-processing of TIR Level 2 product, we know the processing performance of JSS-2.
(i)Implementation of TIR Level 2 programs
(a) Ozone (O3) profile
Processing performance of the TIR Level 2 ozone algorithm is 125 sec for one sounding data at JSS2. We processed the TIR Level 2 ozone products by using the L1B V205.205 for RA users equivalent to V210.210 for general users from February to December 2015, and every September from 2009 to 2017, totally 19 months. The ozone products, which contains amounts of a total ozone and a tropospheric ozone (from surface to about 10 km altitude) were evaluated in temporal variation. We confirmed the ozone retrieval result by using L1B V205.205 had an equivalent accuracy with by using L1B V161.161. Figure 3 shows a global map of the tropospheric ozone by the GOSAT observation in September 2017.
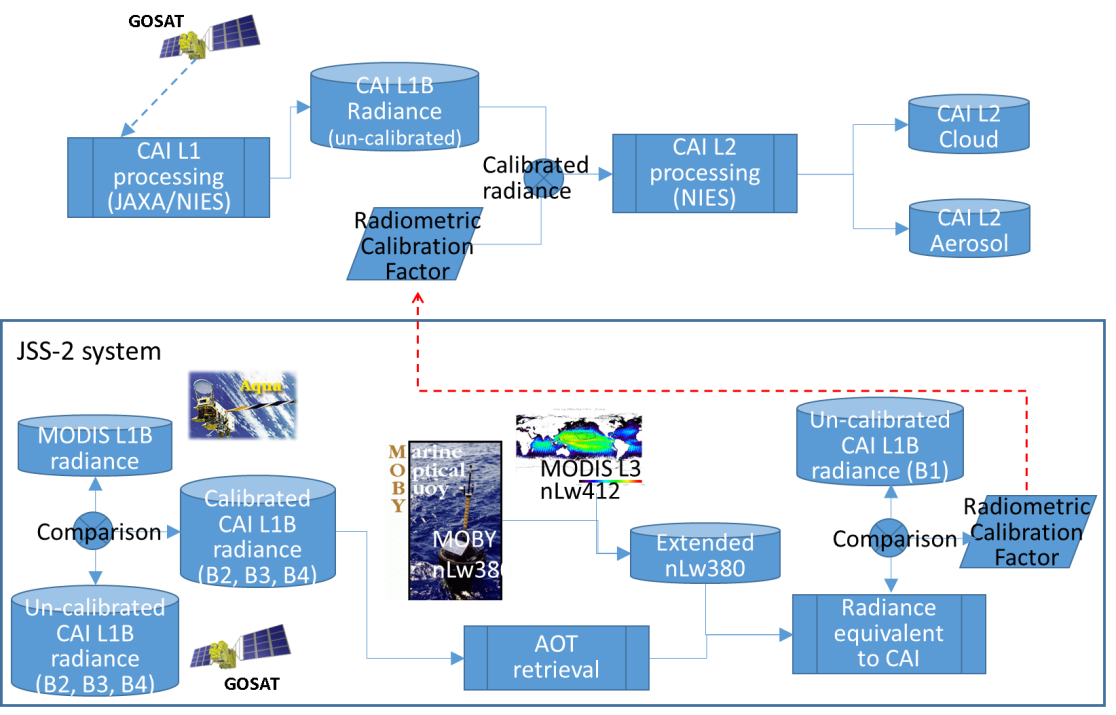
Fig.1: GOSAT CAI processing flow (top) and radiometric calibration flow (bottom)
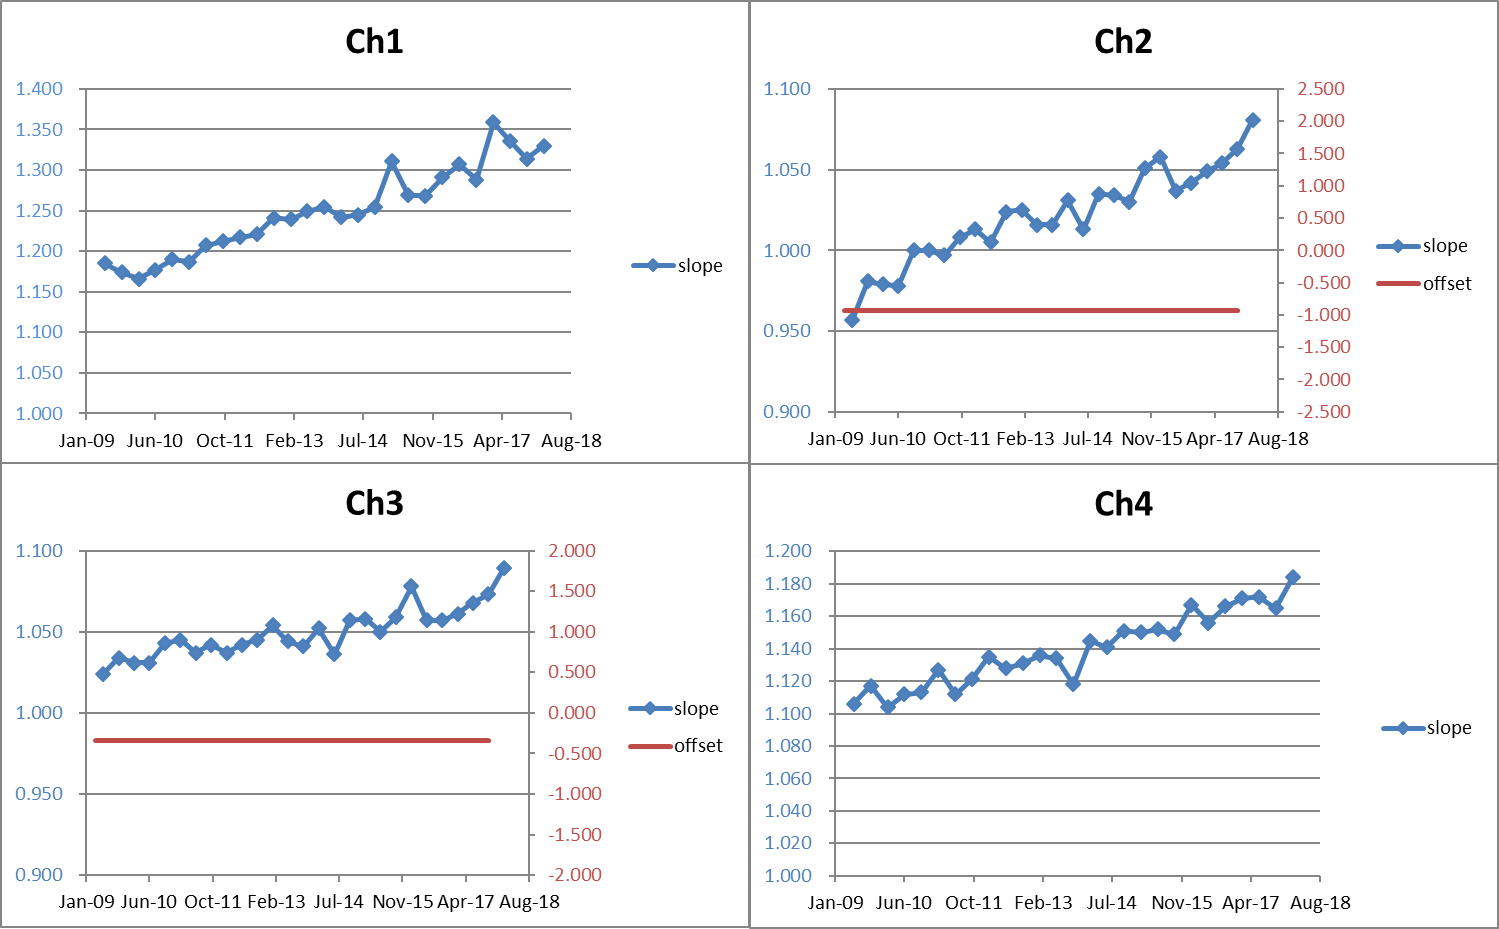
Fig.2: CAI radiometric calibration factor by inter-satellite cross calibration method
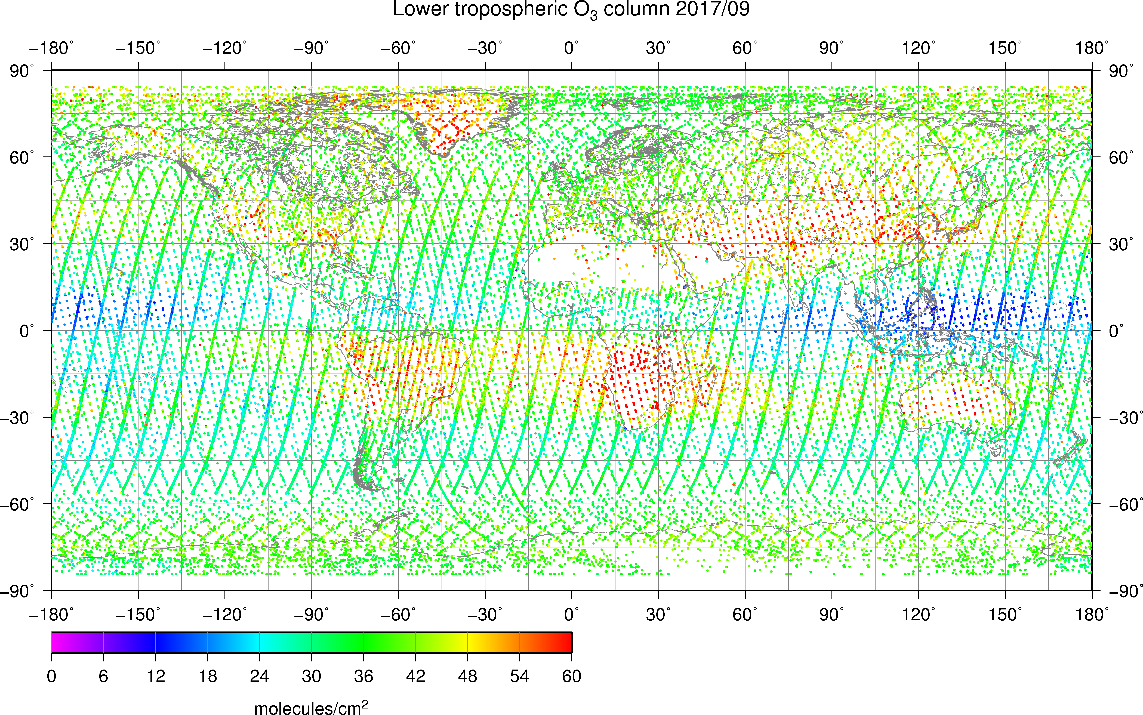
Fig.3: GOSAT FTS TIR tropospheric ozone retrieved by using the L1B v205 in September 2017.
Publications
■ URLs for the Research Results on the Web
1)https://data2.gosat.nies.go.jp/index_en.html (Release of V210.210 FTS L1B product)
Usage of JSS2
Computational Information
- Process Parallelization Methods: N/A
- Thread Parallelization Methods: N/A
- Number of Processes: 1
- Elapsed Time per Case: 480.00 hours
Resources Used
Fraction of Usage in Total Resources*1(%): 0.58
Details
Please refer to System Configuration of JSS2 for the system configuration and major specifications of JSS2.
| System Name | Amount of Core Time(core x hours) | Fraction of Usage*2(%) |
|---|---|---|
| SORA-MA | 0.00 | 0.00 |
| SORA-PP | 531,325.48 | 6.65 |
| SORA-LM | 0.00 | 0.00 |
| SORA-TPP | 3,109.17 | 0.35 |
| File System Name | Storage Assigned(GiB) | Fraction of Usage*2(%) |
|---|---|---|
| /home | 951.49 | 0.66 |
| /data | 278,380.84 | 5.15 |
| /ltmp | 50,618.51 | 3.82 |
| Archiver Name | Storage Used(TiB) | Fraction of Usage*2(%) |
|---|---|---|
| J-SPACE | 4.12 | 0.18 |
*1: Fraction of Usage in Total Resources: Weighted average of three resource types (Computing, File System, and Archiver).
*2: Fraction of Usage:Percentage of usage relative to each resource used in one year.
JAXA Supercomputer System Annual Report April 2017-March 2018