
Satellite: SAOC *1)
JAXA demonstrated experimental re-processing of GCOM-C data by using JSS2
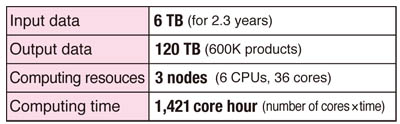
JAXA provides 28 GCOM-C physical products such as aerosols, chlorophyll concentration and sea surface temperature, etc. GCOM-C downlinks such a large amount of observation data as 60-90GB per day, and 1TB per day products are created after data processing. When upgrading the algorithm version, it is necessary to process by going back to the past data. Since it requires a very large-scale re-processing capability, we demonstrated experimental re-processing to confirm whether we can reduce processing time by using JSS2. The calculation result is shown in Table 1. We confirmed it possible to process one day's worth of data in 1.25 days with 280 cores of JSS2. We will implement larger resources of JAXA’s next supercomputer JSS3 for real re-processing and reduce the computing time accordingly.
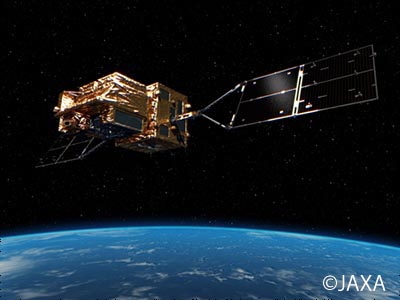
GCOM‐C*(SHIKISAI) was launched on Dec. 23rd, 2017. It is conducting long‐term and continuous global observation and data collection to understand the mechanism of changing radiation budget and carbon cycle needed to project future temperature rise accurately.
*GCOM-C : Global Change Observation Mission –Climate
Please refer to Figure 1, 2 and 3 as for examples of the processed images. We are providing such spectacular earth observation products to users.
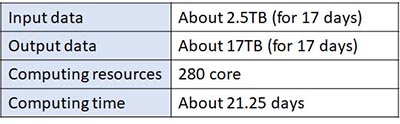
Table1: The computing resources for the experiment.
※We will reduce the computing time with larger number of CPU cores of JSS3.
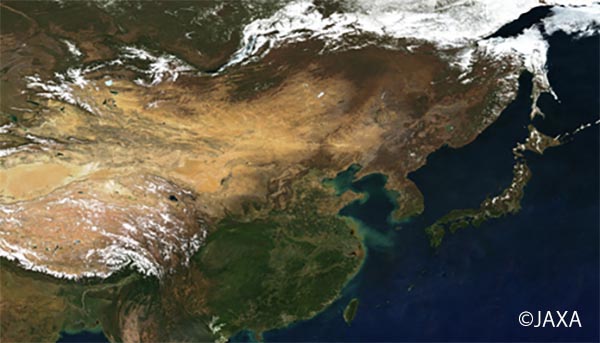
Figure1: This is an RGB image of Asia observed by SHIKISAI on April 16, 2020.
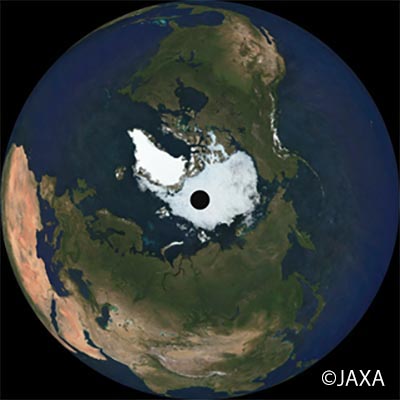
Figure2: This figure shows the state of the Arctic Ocean of August 13, 2020.
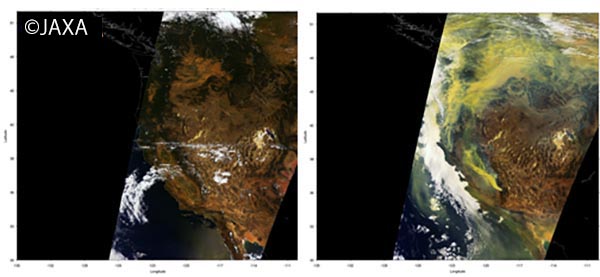
Figure3: This figure shows the forest fire in west coast of USA. Yellow color area represents Fire smoke. Left : August 13, 2020. Right : September 14, 2020.
For Improving Research into Global Change by Quick Delivery of Data Observed From Outer Space
Earth observation by satellites orbiting Earth is an important tool for scientific study of Global Change. Processing of earth observation data includes “routine processing” performed routinely and “re-processing” of several year data performed once a year.
The purpose of re-processing is to correspond with version-up of computing model and algorithm performed periodically.
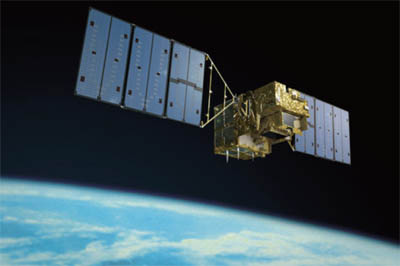
GOSAT: IBUKI
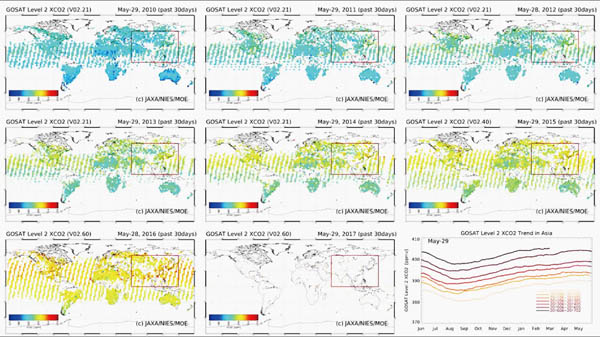
Grobal CO2 Concentrations
These pictures are global CO2 concentrations observed from space by GOSAT from Jun. 2009 to Mar. 2017.
Blue color shows lower CO2 concentrations (370ppm), while red one shows higher CO2 concentrations (410ppm).
The top left picture shows 2009 CO2 concentrations trend.
The top center picture shows 2010 CO2 concentrations trend, and other 6 pictures follow in the same way.
The bottom right animation is CO2 trend graph in Asia,
2009 line graph , 2010 line graph ,,,2016 line graph.
This animations shows, comparing the same month, CO2 concentration has been increased globally year by year.
Grobal CO2 Concentrations
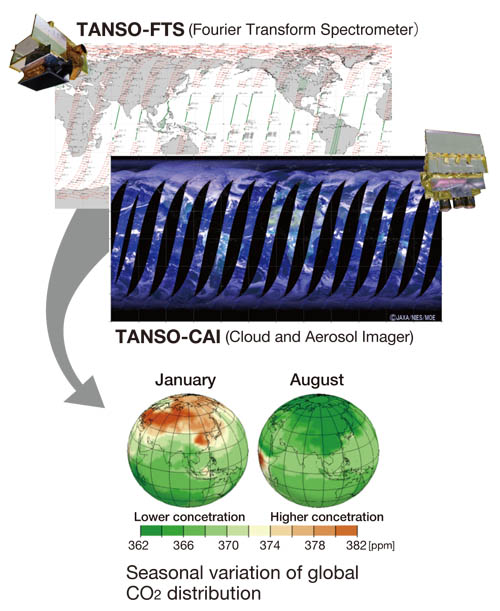
GOSAT(IBUKI): Greenhouse gases Observing SATellite
GOSAT (IBUKI) was launched on Jan. 23rd, 2009 in order to measure the concentration of greenhouse gases globally. It carries two sensors that is; TANSO-FTS to measure carbon dioxide (CO2) and methane (CH4), and TANSO-CAI to measure clouds and aerosol.
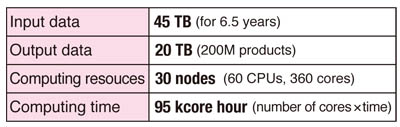
JAXA re-processed 6.5 year TANSO-FTS data in Nov. 2015 (last year) by utilizing JSS2. It took only 11 days, and we could verify speedup more than 30 times comparing with one year by using conventional computers. We are planning TANSO-FTS level 2 and 3 re-processing and TANSO-CAI perfomance verification in future.
GPM: Global Precipitation Measurement mission
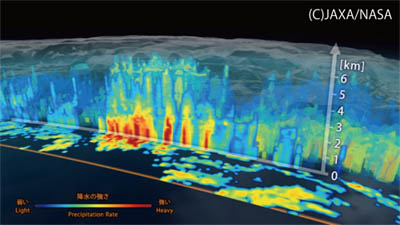
GPM Core Observatory was launched on Feb. 28th (JST), 2014 in order to measure precipitaion in global scale.
It carries Dual-frequency Precipitation Radar (DPR) jointly developed by JAXA and NICT and GPM Microwave Imager (GMI) developed by NASA.
JAXA re-processed 2.3 year DPR data in June 2016 (this year) by utilizing JSS2. It took only 15 days, and we could verify speedup more than 7 times comparing with more than 3 month by using conventional computers.
More information about Satellite
- Greenhouse gases Observing SATellite "IBUKI" (GOSAT)
- Global Precipitation Measurement/Dual-frequency Precipitation Radar (GPM/DPR)
*1) SAOC: Satellite Applications and Operations Center