
Retrieval of greenhouse gas concentrations from GOSAT-2 observations
JAXA Supercomputer System Annual Report February 2023-January 2024
Report Number: R23ER3501
Subject Category: Space Technology
- Responsible Representative: KUZE Akihiko, GOSAT-2 Project Team, Space Technology Directorate I
- Contact Information: Nobuhiro Kikuchi (Earth Observation Research Center)(kikuchi.nobuhiro@jaxa.jp)
- Members: Makiko Hashimoto, Kenji Kowata, Fumie Kataoka, Nobuhiro Kikuchi, Hideyuki Noguchi, Kei Shiomi, Hiroshi Suto, Atsushi Sugano, Shigeaki Wada, Takehito Yoshida
Abstract
Atmospheric concentrations of carbon dioxide, methane and carbon monoxide are retrieved from hyper sectral data measured by The Greenhouse Gasea Observing Sattelite 2 (GOSAT-2). Develepment, validation and imprivement of the retrieva algorithm are also carried out.
Reference URL
Please refer to https://www.eorc.jaxa.jp/earthview/2020/tp200203.html .
Reasons and benefits of using JAXA Supercomputer System
The JAXA supercomputer system is used to retrieved greenhouse gas concentrations from measurement data of the GOSAT-2 satellite. About 100 hours of CPU time is needed to process 1day mesurement data. It takes about 1 hour to process 1 day measurement data, using 10 nodes of the PrePost system computers with 12 cores.
Achievements of the Year
We are developing the JAXA/EORC research algorithm (Level 2 algorithm) for GOSAT and GOSAT-2 which derives from the Level 1 data the atmospheric concentrations of carbon dioxide and methane. The simultaneous use of both shortwave infrared (SWIR) and thermal infrared (TIR) spectra is one of the characteristics of our algorithm, which enables us to retrieve not only the column averaged concentrations, but also the vertical profiles with up to two layers in the troposphere for carbon dioxide and methane. We also utilize the polarization information in the SWIR to correct the undesirable effects of aerosols on the accurate retrievals the greenhouse gas concentrations. GOSAT and GOSAT-2 are equipped with sensors with almost the same specifications, and the same Level 2 algorithms can be applied to them. However, in order to obtain the same results (carbon dioxide and methane concentrations) from the data from the two satellites, careful evaluation of sensor characteristics is required.
In the previous year, we made a significant improvement in the accuracy of the retrieved greenhouse gas concentrations by optimizing the instrument line-shape function, and the column average concentrations of carbon dioxide and methane derived from GOSAT and GOSAT-2 now agree within the retrieval error. This year, GOSAT-2 Level 1 data (V210210) were processed on JSS3 to obtain approximately five years data of carbon dioxide and methane global concentrations (and also carbon monoxide). In addition, the quality-controlled data with cloud screening were released as a JAXA/EORC research product (version 3). The data is available from February 2019, when a regular operation of GOSAT-2 started, to December 2023. For GOSAT, we processed Level 1 data (V230231) and the long-term data are now available for more than 14 years from June 2009 to December 2023.
Figure 1 shows the monthly mean of the carbon dioxide concentration in 2023. From the left to the right columns, the months are January, April, July, and October. The top row shows the column average concentration (XCO2), and the middle row shows the lower tropospheric concentration (XCO2_LT). It can be seen that the global mean concentration of carbon dioxide reaches its maximum in April every year, and that areas of high concentration are concentrated in the continental areas of the Northern Hemisphere. It can be seen that the concentration of carbon dioxide in the lower troposphere is high not only in urban areas but also in northern Eurasia, including Siberia. Carbon dioxide concentrations in Siberia drop rapidly in the summer. Comparing the column average concentration and the lower tropospheric concentration, the latter has a higher spatial correlation with carbon dioxide absorption and emission sources. The bottom row shows the column average concentration of carbon monoxide, which primarily traces forest fires. Forest fires occur every year in places such as the Amazon, central Africa, and the Indochina Peninsula. It can be seen that there is a spatial correlation between concentrations of carbon monoxide and carbon dioxide in the lower troposphere.
Similarly, Figure 2 shows the monthly mean of the methane concentration in 2023. The upper row shows the column average concentration (XCH4), and the lower row shows the lower tropospheric concentration (XCH4_LT). Methane sources are thought to be located in central Africa, Siberia, and a narrow region from India to China, and these are also highly correlated with lower tropospheric concentrations.
In general, the transport error is one of the error sources when we try to estimate absorption and emissions from greenhouse gas concentrations using an atmospheric transport model. Using lower tropospheric concentrations, which have a high spatial correlation with absorption and emission sources, can reduce the effects of transport errors, potentially improving the accuracy of estimating absorption and emissions. Although there is almost no difference in the column-averaged concentrations derived by the current version 3 algorithm between GOSAT and GOSAT-2, systematic differences can be seen in the lower tropospheric concentrations (Figures 3 and 4). We would like to continue making improvements and contribute to improving the estimation accuracy of carbon dioxide and methane absorption and emissions.
Caption 1
Monthly mean of the column averaged concentrations of carbon dioxide in 2023. From the left row, January, April, July and October. (upper) column-averaged concentrations. (middle) lower-tropospheric concentrations. (lower) column-averaged concentrations of carbon monoxide.
Caption 2
Monthly mean of the column averaged concentrations of methane in 2023. From the left row, January, April, July and October. (upper) column-averaged concentrations. (lower) lower-tropospheric concentrations.
Caption 3
(left) Comparison of the column averaged concentrations of carbon dioxide retrieved from GOSAT and GOSAT-2. (right) Similar to left, but for the lower tropospheric concentrations.
Caption 4
(left) Comparison of the column averaged concentrations of methane retrieved from GOSAT and GOSAT-2. (right) Similar to left, but for the lower tropospheric concentrations.

Fig.1: Monthly mean of the column averaged concentrations of carbon dioxide in 2023. From the left row, January, April, July and October. (upper) column-averaged concentrations. (middle) lower-tropospheric concentrations. (lower) column-averaged concentrations of carbon monoxide.
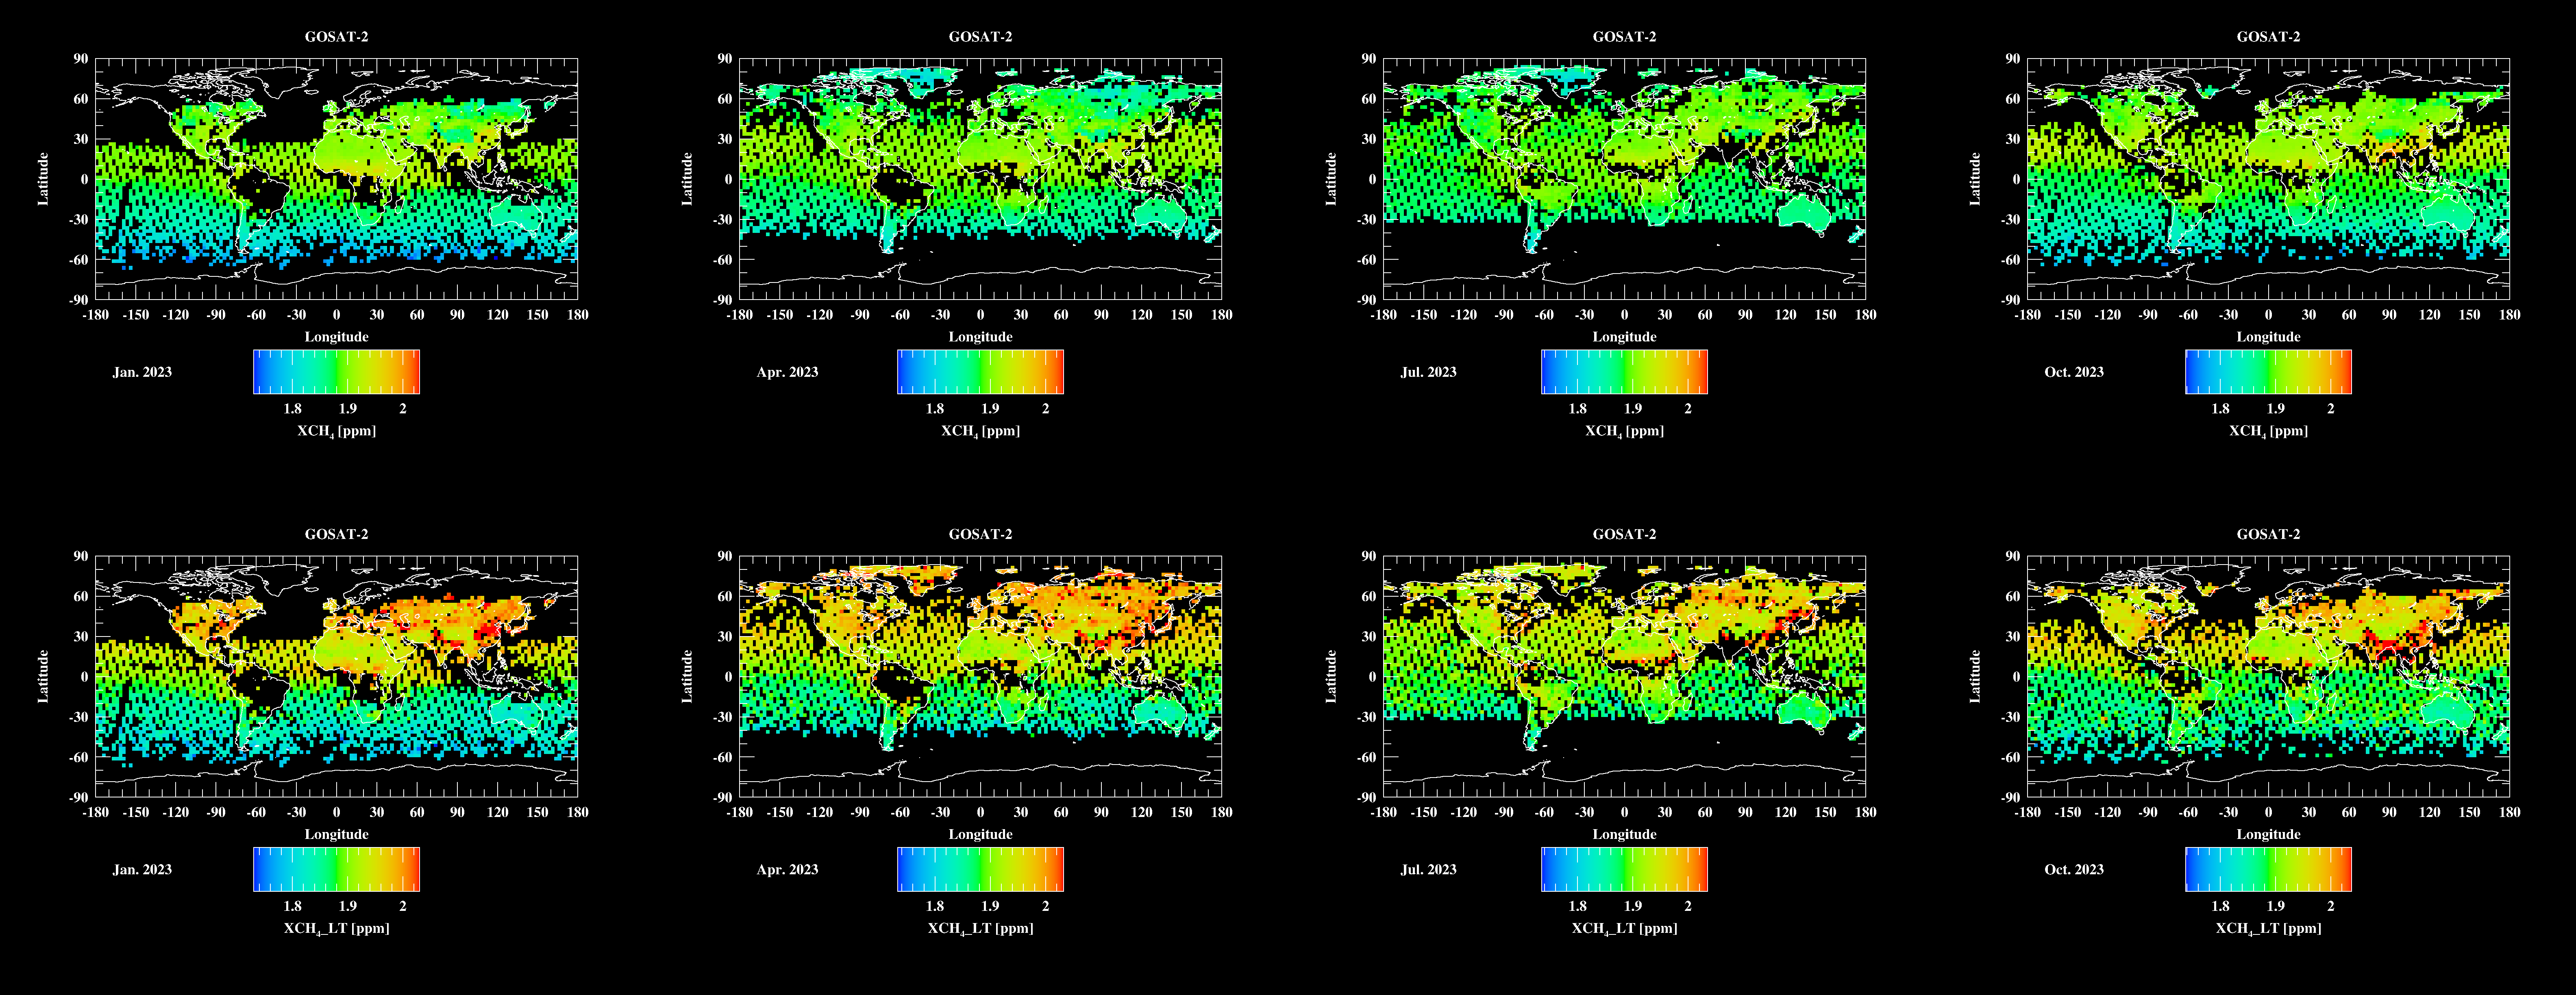
Fig.2: Monthly mean of the column averaged concentrations of methane in 2023. From the left row, January, April, July and October. (upper) column-averaged concentrations. (lower) lower-tropospheric concentrations.
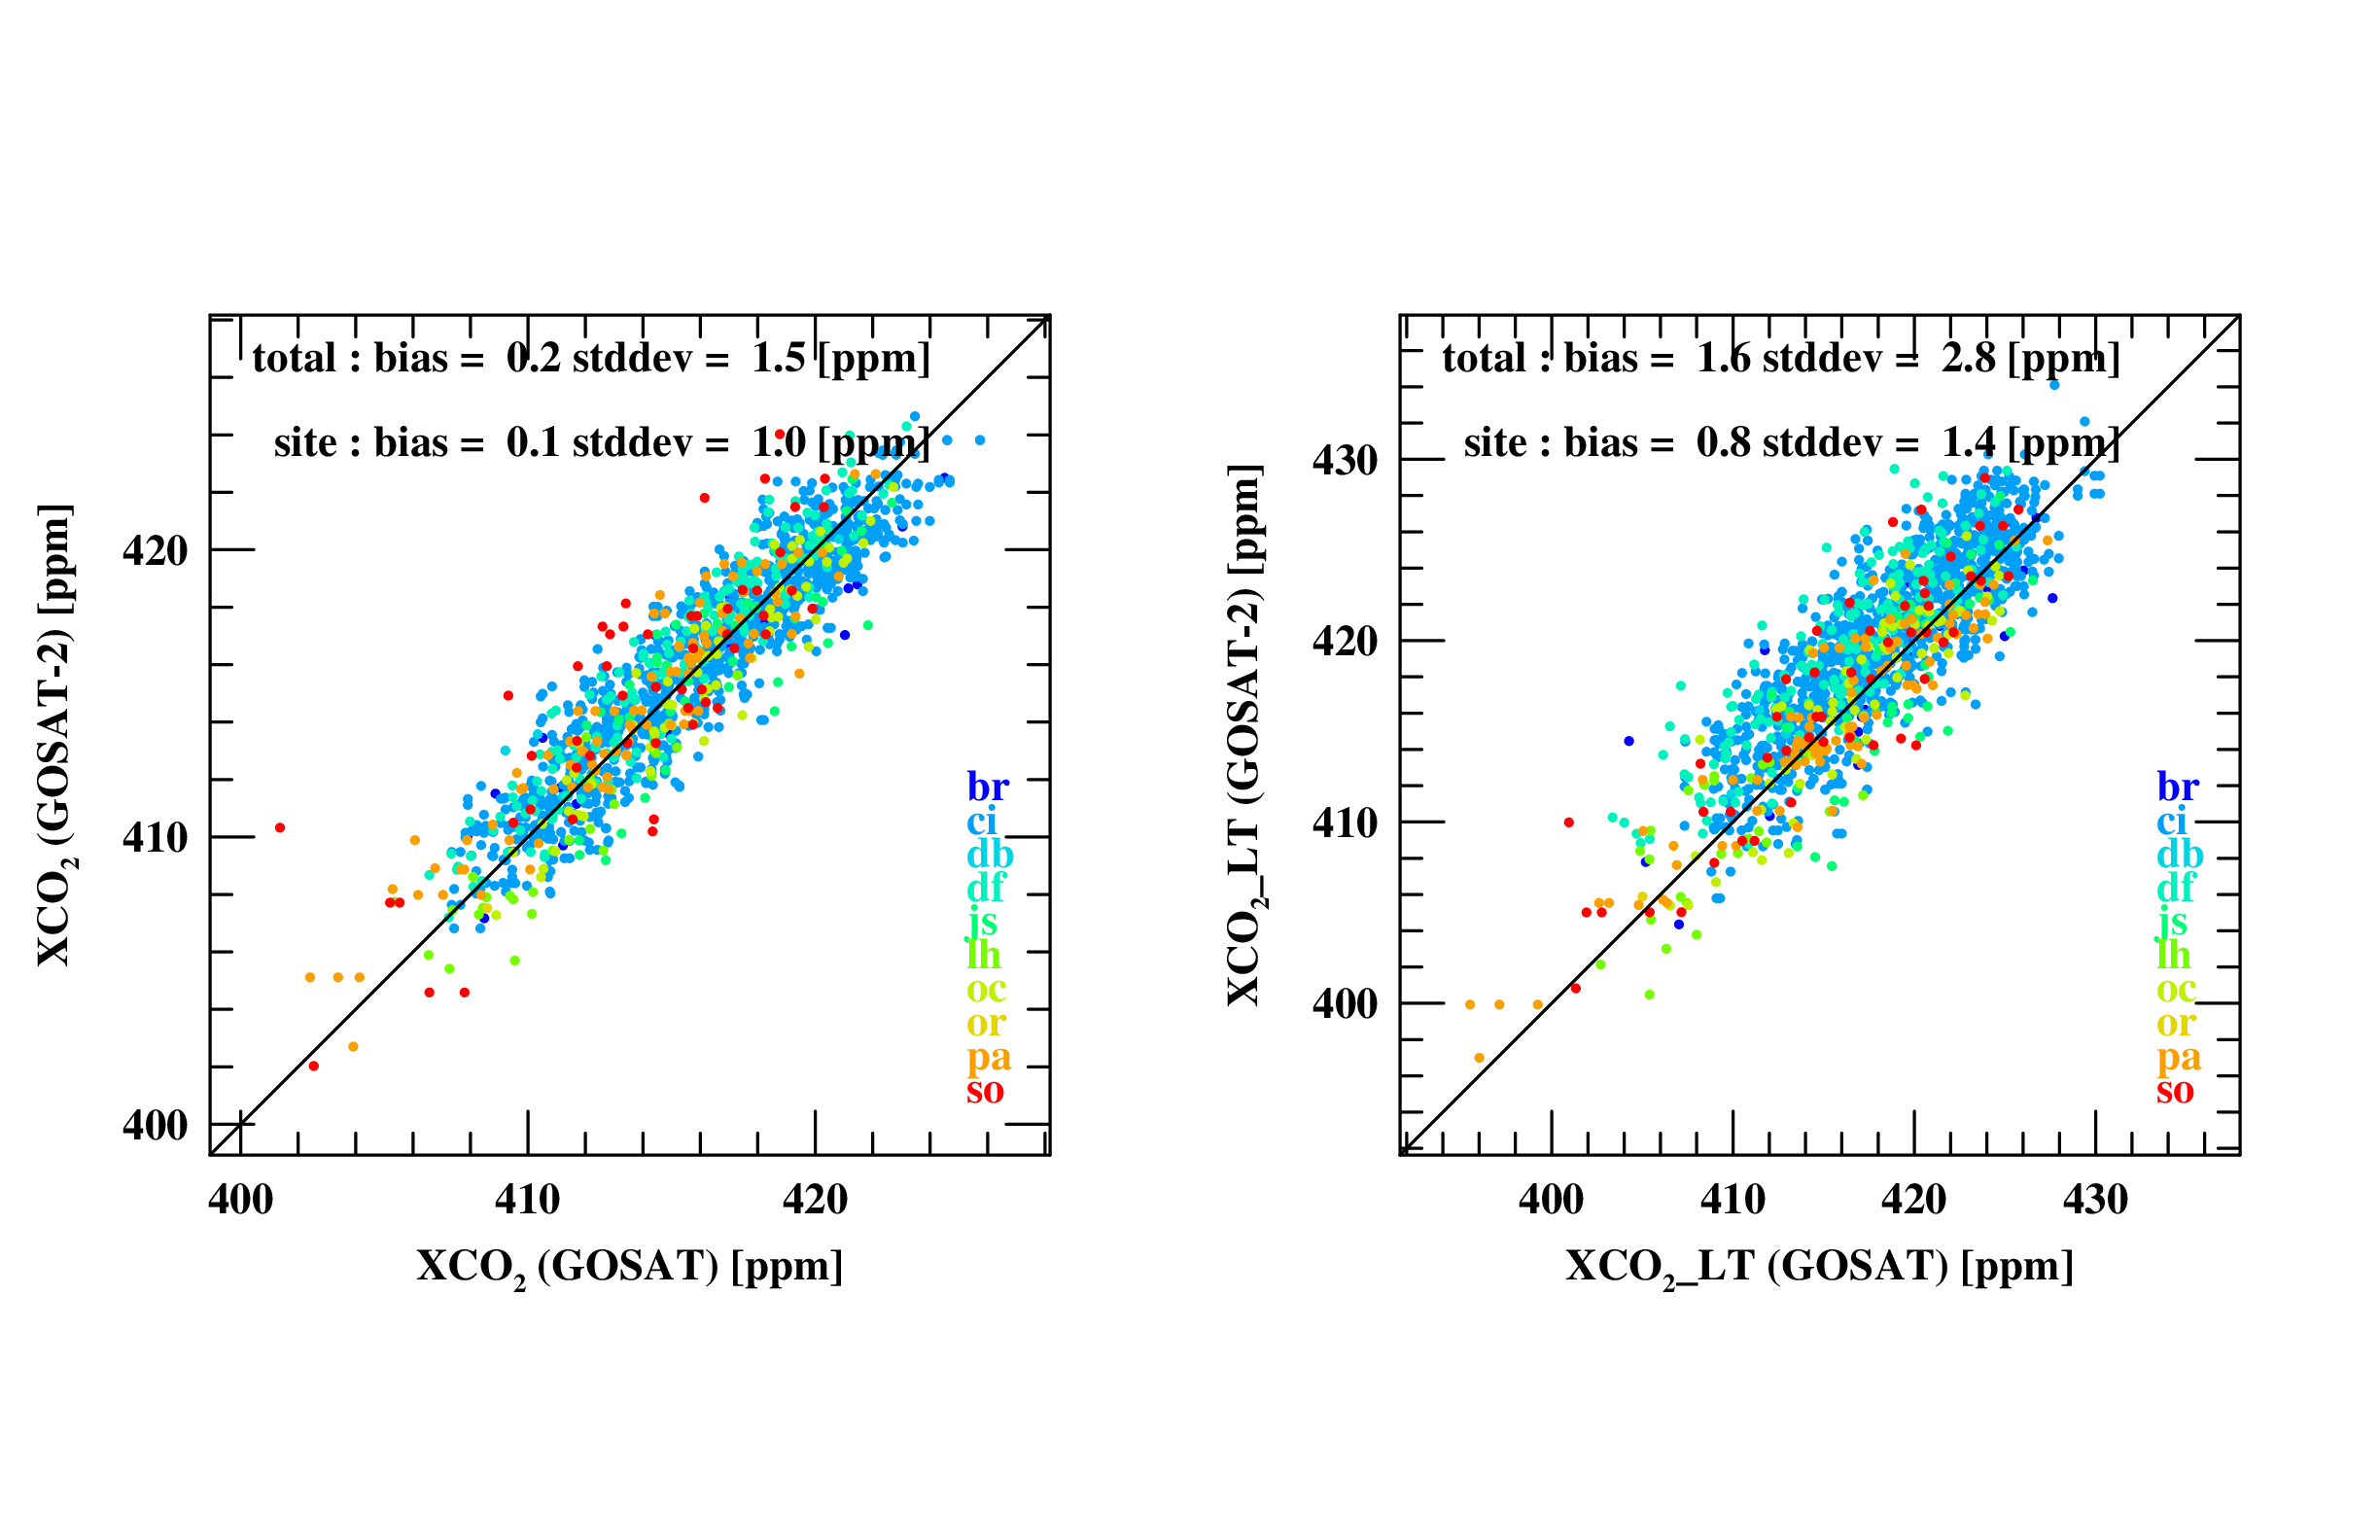
Fig.3: (left) Comparison of the column averaged concentrations of carbon dioxide retrieved from GOSAT and GOSAT-2. (right) Similar to left, but for the lower tropospheric concentrations.
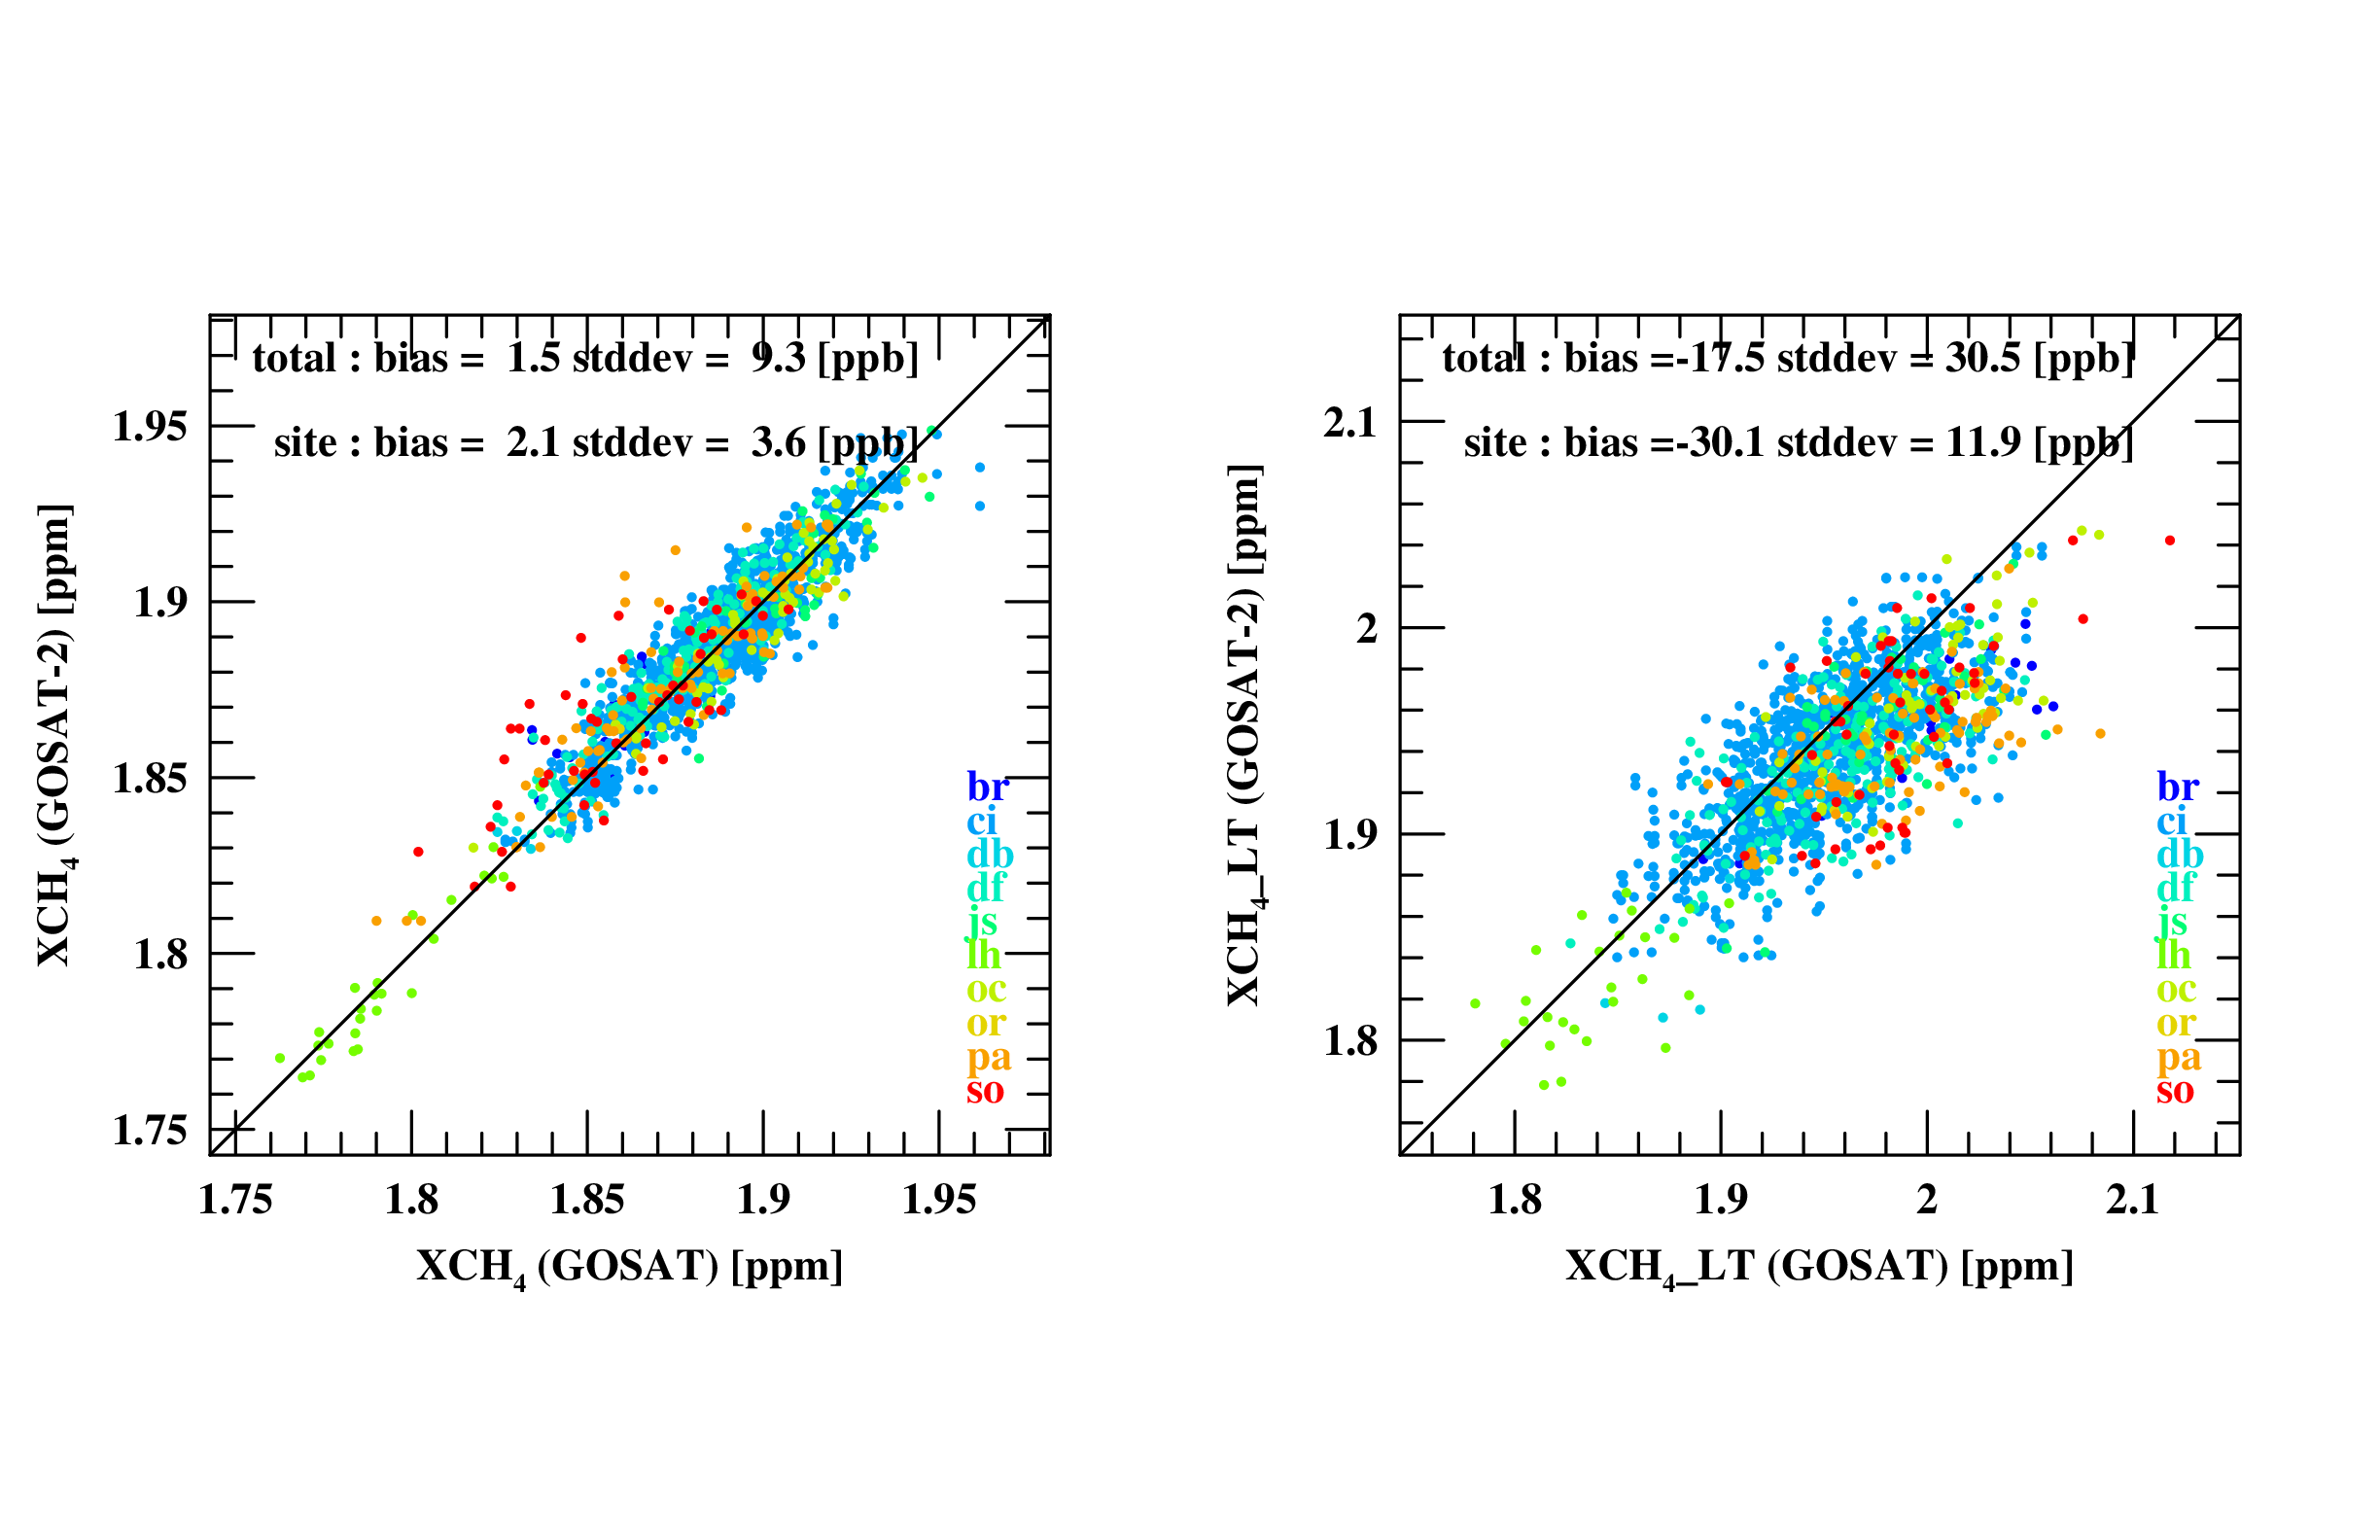
Fig.4: (left) Comparison of the column averaged concentrations of methane retrieved from GOSAT and GOSAT-2. (right) Similar to left, but for the lower tropospheric concentrations.
Publications
- Web
https://www.eorc.jaxa.jp/GOSAT/GPCG/index_GOSAT2.html
Usage of JSS
Computational Information
- Process Parallelization Methods: N/A
- Thread Parallelization Methods: OpenMP
- Number of Processes: 1
- Elapsed Time per Case: 10 Hour(s)
JSS3 Resources Used
Fraction of Usage in Total Resources*1(%): 0.03
Details
Please refer to System Configuration of JSS3 for the system configuration and major specifications of JSS3.
| System Name | CPU Resources Used(Core x Hours) | Fraction of Usage*2(%) |
|---|---|---|
| TOKI-SORA | 0.00 | 0.00 |
| TOKI-ST | 212230.16 | 0.23 |
| TOKI-GP | 0.00 | 0.00 |
| TOKI-XM | 0.00 | 0.00 |
| TOKI-LM | 0.00 | 0.00 |
| TOKI-TST | 0.00 | 0.00 |
| TOKI-TGP | 0.00 | 0.00 |
| TOKI-TLM | 0.00 | 0.00 |
| File System Name | Storage Assigned(GiB) | Fraction of Usage*2(%) |
|---|---|---|
| /home | 0.00 | 0.00 |
| /data and /data2 | 102400.00 | 0.63 |
| /ssd | 0.00 | 0.00 |
| Archiver Name | Storage Used(TiB) | Fraction of Usage*2(%) |
|---|---|---|
| J-SPACE | 265.44 | 0.96 |
*1: Fraction of Usage in Total Resources: Weighted average of three resource types (Computing, File System, and Archiver).
*2: Fraction of Usage:Percentage of usage relative to each resource used in one year.
ISV Software Licenses Used
| ISV Software Licenses Used(Hours) | Fraction of Usage*2(%) | |
|---|---|---|
| ISV Software Licenses(Total) | 0.00 | 0.00 |
*2: Fraction of Usage:Percentage of usage relative to each resource used in one year.
JAXA Supercomputer System Annual Report February 2023-January 2024