
Feedback Control of Flow Separation Using DBD Plasma Actuator
JAXA Supercomputer System Annual Report February 2022-January 2023
Report Number: R22EACA26
Subject Category: JSS Inter-University Research
- Responsible Representative: Kengo Asada, Assistant Professor, Department of Information and Computer Technology, Faculty of Engineering, Tokyo University of Science
- Contact Information: Kengo Asada(asada@rs.tus.ac.jp)
- Members: Kengo Asada, Takuto Ogawa
Abstract
The project develops flow control technic by using dielectric barrier discharge (DBD) plasma actuator to establish high efficient and robust vehicle systems such as rockets, aircrafts, and motor vehicles. We propose and demonstrate feedback control methods to adapt unsteady flows over the vehicles through a series of high-fidelity unsteady simulations.
Reference URL
N/A
Reasons and benefits of using JAXA Supercomputer System
To perform large-scale three-dimensional unsteady flow simulations using the compressible fluid solver LANS3D, which has a wealth of computational achievements with a JAXA supercomputer system.
Achievements of the Year
This project proposes a feedback control method (Fig. 1) for flow separation control around a NACA0015 airfoil (Reynolds number: 63,000) using a DBD plasma actuator (PA) and verifies its performance. The proposed feedback model regards the decrease in pressure value measured by a pressure sensor placed on the airfoil surface as a vortex passage and switches the driving state of the actuator placed near the leading edge of the airfoil according to the vortex passage.
In the fourth fiscal year of Reiwa, continuing from last year, we conducted a parametric study for the drive frequency of standard burst drive to improve the control authority at low angles of attack. Unlike feedback control, the standard burst drive is a drive method that switches a PA driving state ON and OFF according to a predetermined nondimensional burst frequency F+. The PA was positioned 5% of the chord length from the leading edge, and the angle of attack was set to 2 degrees. In this fiscal year, in addition to the nondimensional frequencies 1 and 6, which have been considered effective for the angle of attack after stall, higher frequencies 12 and 30 were investigated.
Figure 2 shows the lift-to-drag ratio and aerodynamic coefficients at each burst frequency. BR is the burst ratio, which represents the ratio of the ON and OFF duration of PA. BR is chosen so that the input energy is the same as much as possible at each burst frequency. ”Continuous” denotes the continuous drive. The lift-to-drag ratio is the highest at F+=12, and the lift is the highest at F+=30. The drag force is the smallest at F+=6. Figure 3 shows the distributions of the pressure coefficient (Cp) and skin friction coefficient (Cf). In the case where PA is not used (PA-OFF), a plateau Cp distribution is seen in the area from 60% to 80% of the cord length, and Cf is negative in this area, indicating flow separation. In the F+=30 and Continuous cases, the plateau Cp area shifted toward the trailing edge. In the F+=1 and 6 cases, the plateau Cp area is not seen. The case of F+=12 has a Cp distribution close to PA-OFF, but the pressure is slightly higher in the area from 70% to 80% of the chord length. Therefore, the drag is lower than PA-OFF, resulting in the highest L/D. Figure 4 shows the instantaneous flow fields for each case. In the PA-OFF case, the laminar flow separates around the middle of the airfoil and reattaches after the turbulent transition. Although the transition reattachment position of the F+=12 case, whose Cp distribution was similar to that of the PA-OFF case, was almost the same as that of the PA-OFF case, the two-dimensional vortices generated by PA are seen on the airfoil surface. Due to the advection of these vortices, the time-averaged pressure in the separation region becomes higher than that of PA-OFF. In addition, in the case of F+=6, the two-dimensional vortices are maintained up to the trailing edge without collapsing, whereas in the high-frequency F+=30 and Continuous cases, the position of the turbulent transition and the reattachment is downstream compared to PA-OFF.
As described above, the flow in the separation region changes depending on the burst frequency, and the aerodynamic coefficient also changes greatly. F+=12 is good from the viewpoint of lift-to-drag ratio improvement, but F+=30 is appropriate from the viewpoint of lift improvement. It is expected that more robust control can be achieved if a control mechanism that can automatically switch the drive frequency reflecting on these findings is incorporated into the feedback control method.
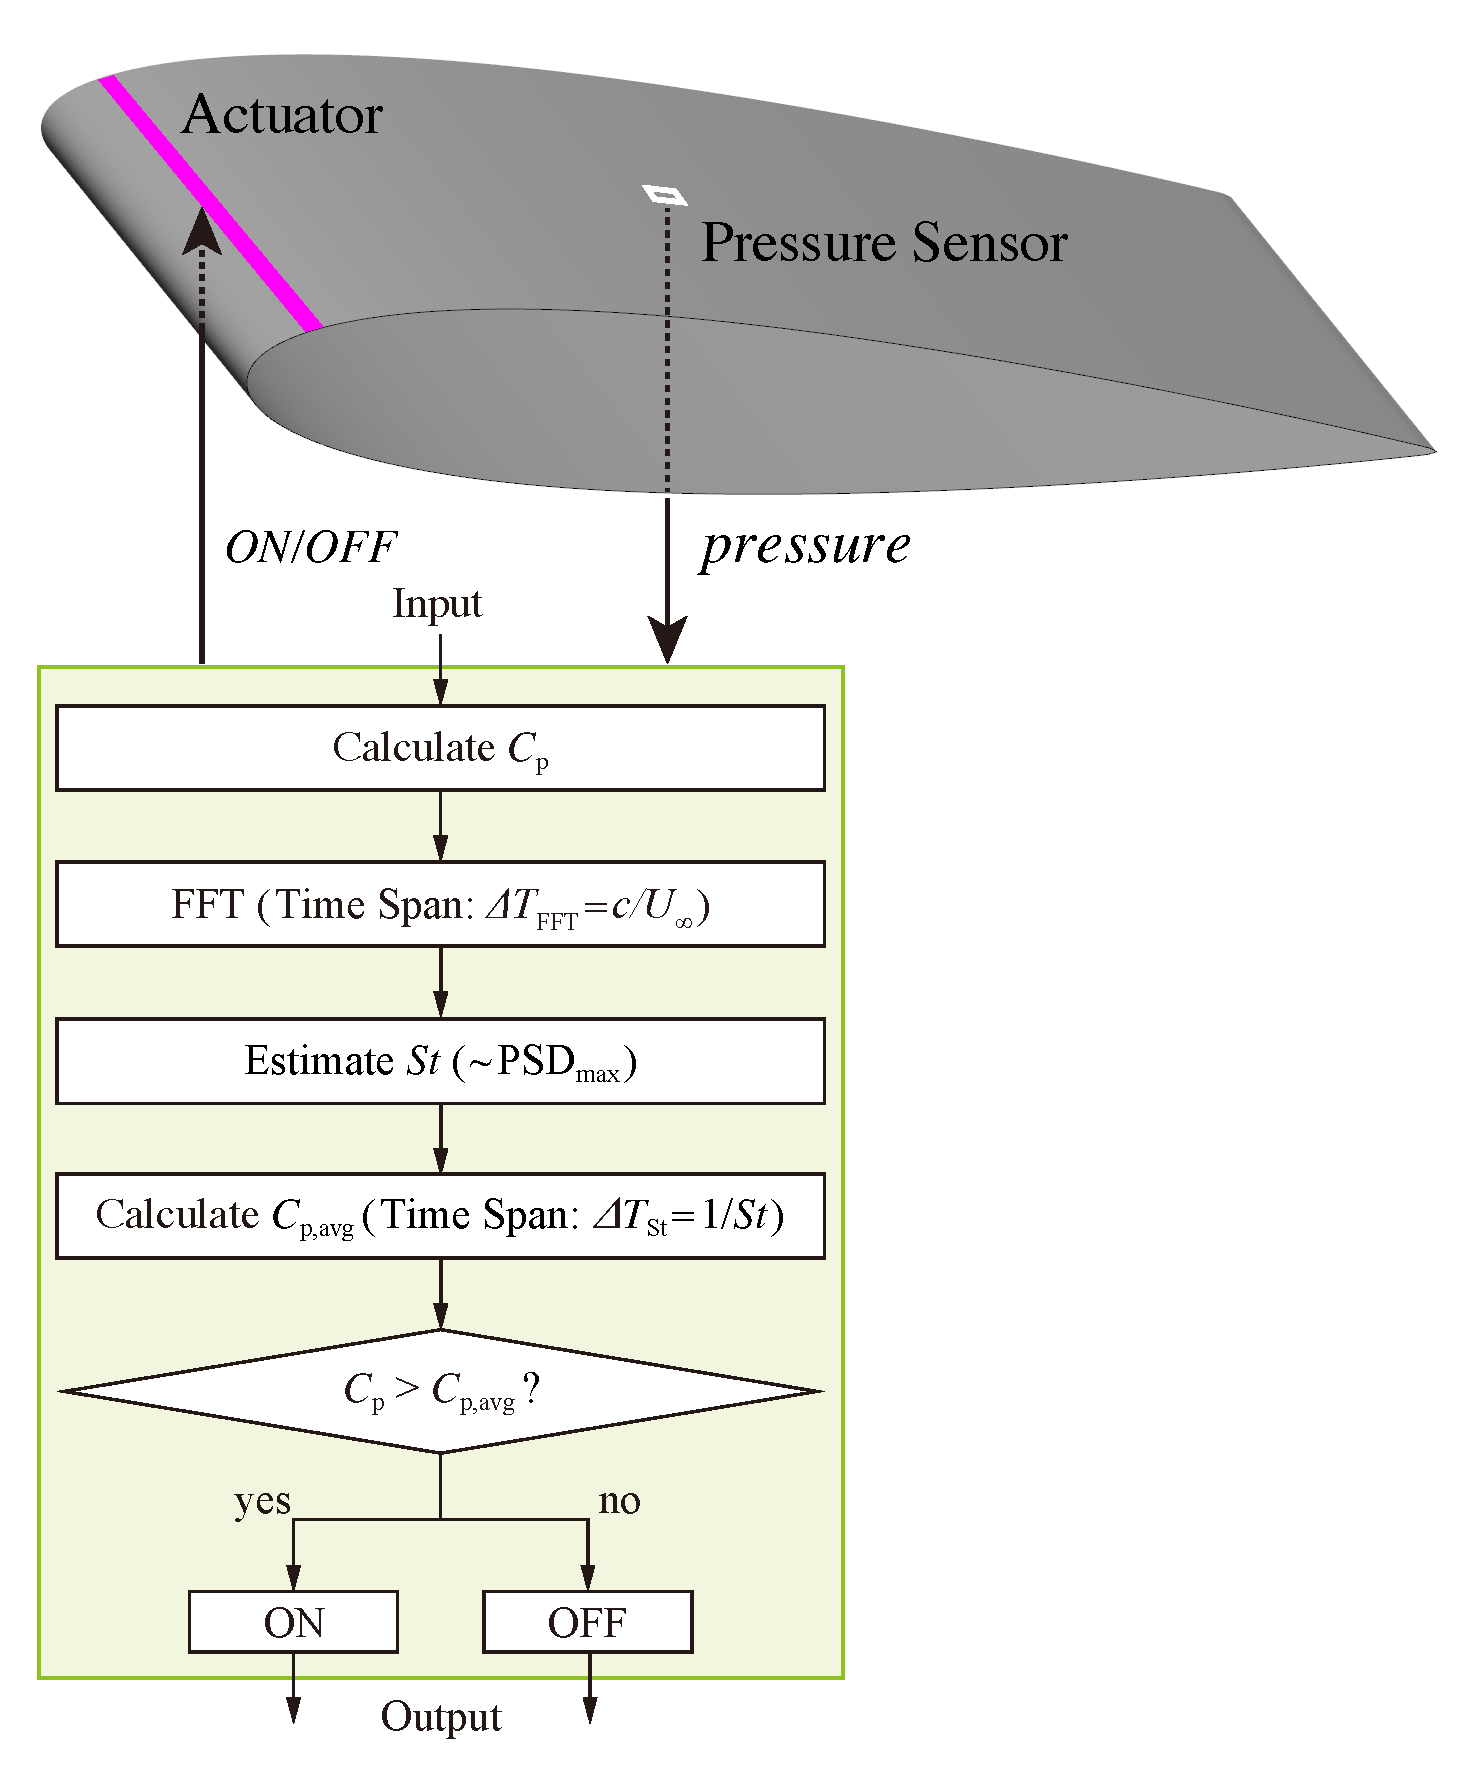
Fig.1: Proposed feedback control model for airfoil flow separation

Fig.2: Lift and drag ratio (L/D), lift coefficient (CL), and drag coefficient (CD)
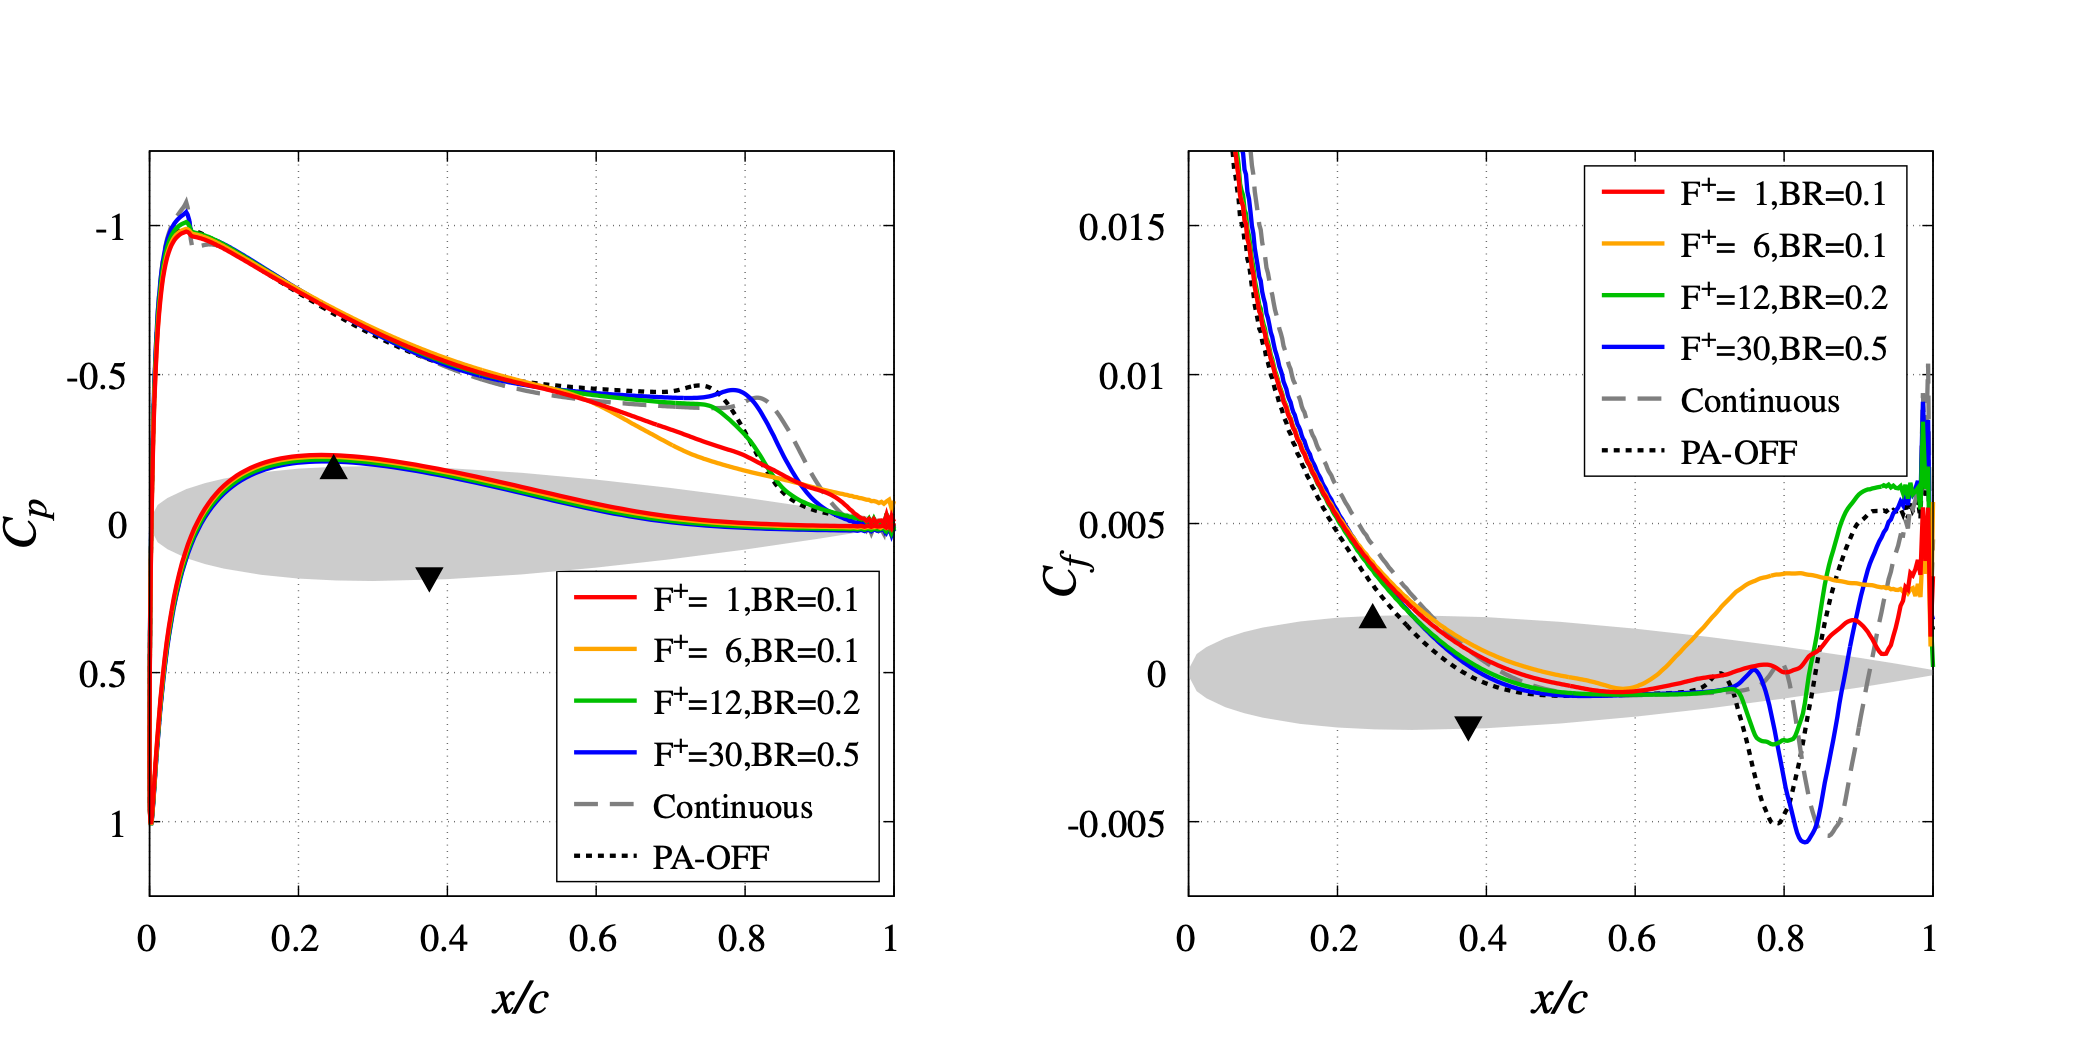
Fig.3: Distribution of pressure coefficient (Cp) and skin friction coefficient (Cf)
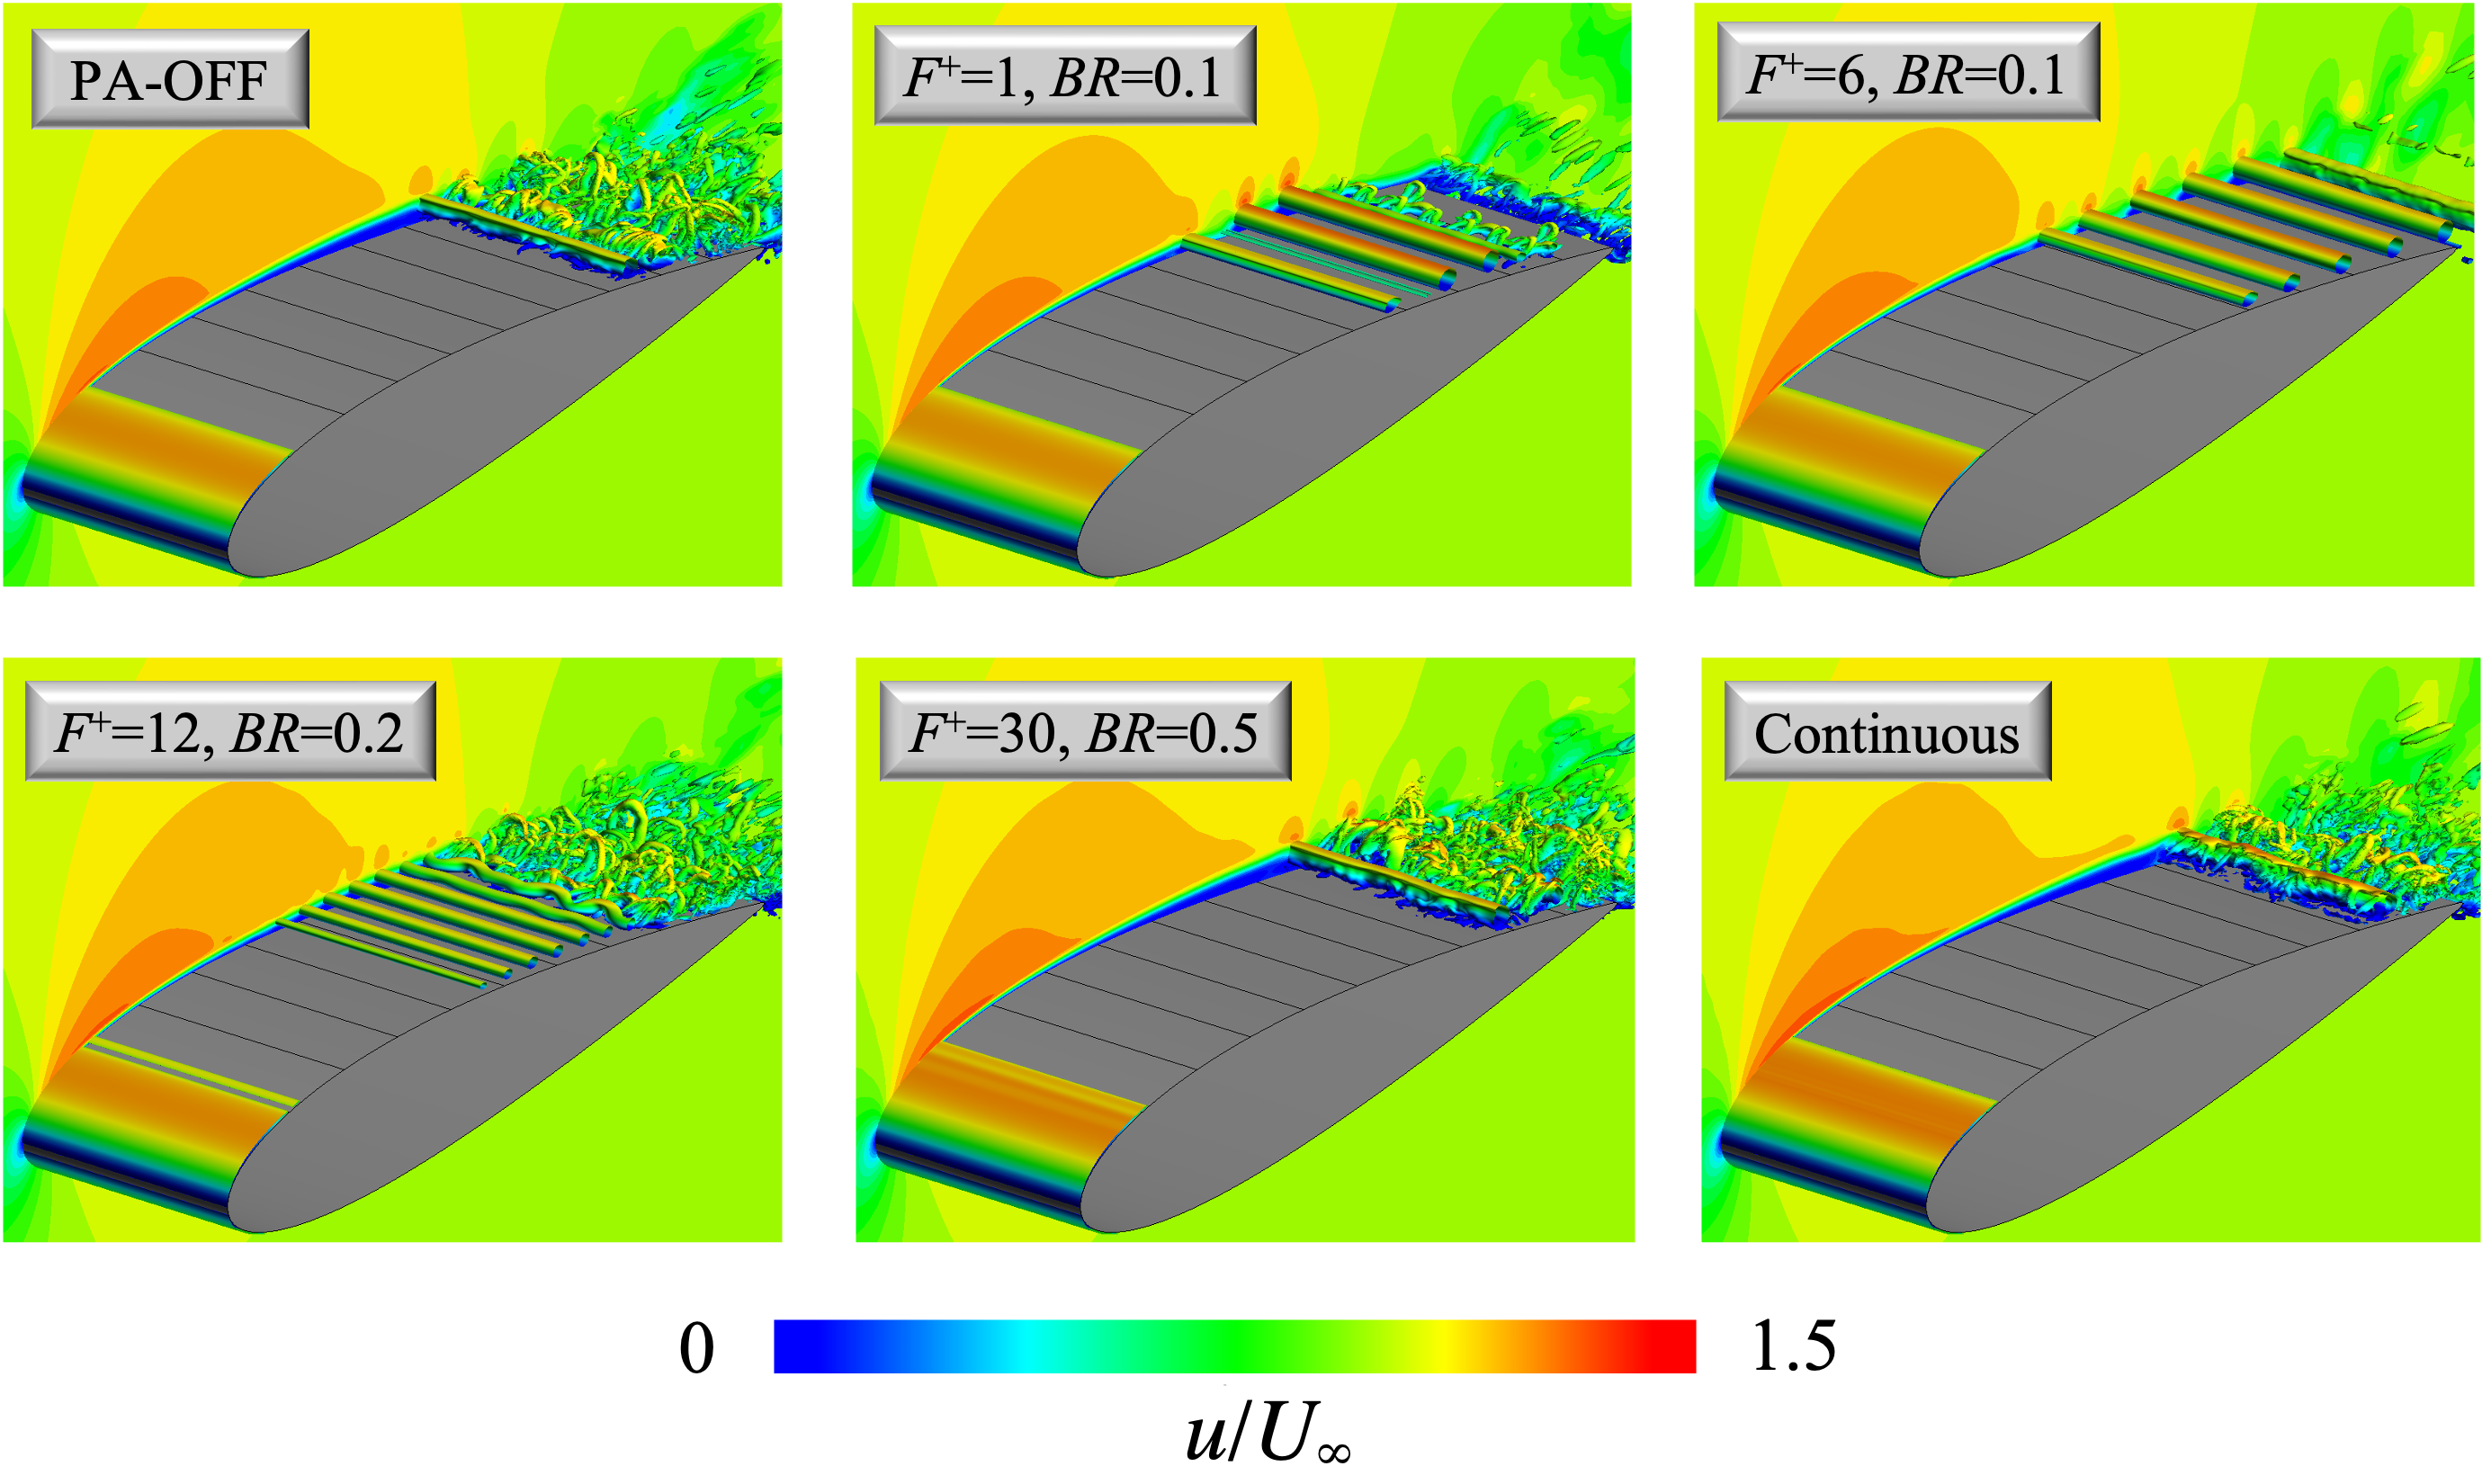
Fig.4: Instantaneous flow fields
Publications
– Peer-reviewed papers
Takuto Ogawa, Kengo Asada, Makoto Sato, Tomoaki Tatsukawa, Kozo Fujii, “Computational Study of the Plasma Actuator Flow Control for an Airfoil at Pre-Stall Angles of Attack,” Applied Sciences MDPI, Vol. 12, No. 18, Sept. 2022.
Usage of JSS
Computational Information
- Process Parallelization Methods: MPI
- Thread Parallelization Methods: Automatic Parallelization
- Number of Processes: 79
- Elapsed Time per Case: 40 Hour(s)
JSS3 Resources Used
Fraction of Usage in Total Resources*1(%): 0.30
Details
Please refer to System Configuration of JSS3 for the system configuration and major specifications of JSS3.
| System Name | CPU Resources Used(Core x Hours) | Fraction of Usage*2(%) |
|---|---|---|
| TOKI-SORA | 8075364.21 | 0.35 |
| TOKI-ST | 0.00 | 0.00 |
| TOKI-GP | 0.00 | 0.00 |
| TOKI-XM | 0.00 | 0.00 |
| TOKI-LM | 0.00 | 0.00 |
| TOKI-TST | 0.00 | 0.00 |
| TOKI-TGP | 0.00 | 0.00 |
| TOKI-TLM | 0.00 | 0.00 |
| File System Name | Storage Assigned(GiB) | Fraction of Usage*2(%) |
|---|---|---|
| /home | 60.00 | 0.05 |
| /data and /data2 | 16758.09 | 0.13 |
| /ssd | 200.00 | 0.03 |
| Archiver Name | Storage Used(TiB) | Fraction of Usage*2(%) |
|---|---|---|
| J-SPACE | 11.12 | 0.05 |
*1: Fraction of Usage in Total Resources: Weighted average of three resource types (Computing, File System, and Archiver).
*2: Fraction of Usage:Percentage of usage relative to each resource used in one year.
ISV Software Licenses Used
| ISV Software Licenses Used(Hours) | Fraction of Usage*2(%) | |
|---|---|---|
| ISV Software Licenses(Total) | 0.00 | 0.00 |
*2: Fraction of Usage:Percentage of usage relative to each resource used in one year.
JAXA Supercomputer System Annual Report February 2022-January 2023