
Numerical Analysis of the Effect of Vehicle Shape and Protuberance on the Aerodynamic Characteristics of Slender Body
JAXA Supercomputer System Annual Report February 2022-January 2023
Report Number: R22EACA21
Subject Category: JSS Inter-University Research
- Responsible Representative: Keiichi Kitamura, Associate Professor, Yokohama National University
- Contact Information: Shogo Motoki (Yokohama National University)(motoki-shogo-pt@ynu.jp)
- Members: Keiichi Kitamura, Tomohiro Mamashita, Shogo Motoki, Koya Mineshima
Abstract
Protuberances on the surface of a space transportation vehicle affect the aerodynamic characteristics, particularly the side force. In this study, steady-state calculations are performed under transonic conditions (Mach 0.7-1.3) on a slender body with protuberances to understand the effect of multiple protuberances on transonic aerodynamic characteristics. The results show that the side force increases when the second protuberance is placed on the leeward side (azimuthal angle 45 deg.) at Mach 0.7. Also, when its position is 0.22L from the first, the side force is greater. However, when the second protuberance is placed at 0.11L from the first, the side force is almost the same as without the second protuberance. This is because the vortices generated by each protuberance are combined to form a single vortex. At Mach 1.3, the change in side force is minor because of the smaller vortex generated from the second protuberance.
Reference URL
N/A
Reasons and benefits of using JAXA Supercomputer System
In this research, there were many calculation cases because we handled various shapes and flow conditions, and the number of grid points was very large because we required high-resolution results. For this reason, we needed to use the supercomputer.
Achievements of the Year
Numerical analysis was performed on slender bodies with two protuberances (Fig. 1) at 15 degrees angle of attack in the range of Mach number of 0.7-1.3 to investigate the relationship between the positions of the two protuberances and the side force coefficient (Fig. 2). As a result, at Mach 0.7, the side force is greater when the second protuberance was placed at 44% of the length of the vehicle (the distance between two protuberances is 22% of the length of the vehicle). The vorticity distribution around the vehicle for the case with the second protuberance at the 55% (Fig. 3) shows that the vortices generated by the two protuberances are independent of each other. The vortex of the second protuberance has the effect of increasing the side force, and the area affected by it (the area from the protuberance to the base) is larger when the second protuberance is placed upstream. Therefore, the side force is greater when the second protuberance is placed at 44%, and the side force is smaller when it is placed downstream. However, the side force is smaller when it is placed at 33%, which is upstream of 44%. This is because the two vortices merge (Fig. 4) due to the proximity of the two protuberances (11% of the length of the vehicle) and the side force-increasing effect of the second vortex does not occur. At Mach 1.3, the change in side force is minor (Fig. 2) because of the smaller vortex generated from the second protuberance.
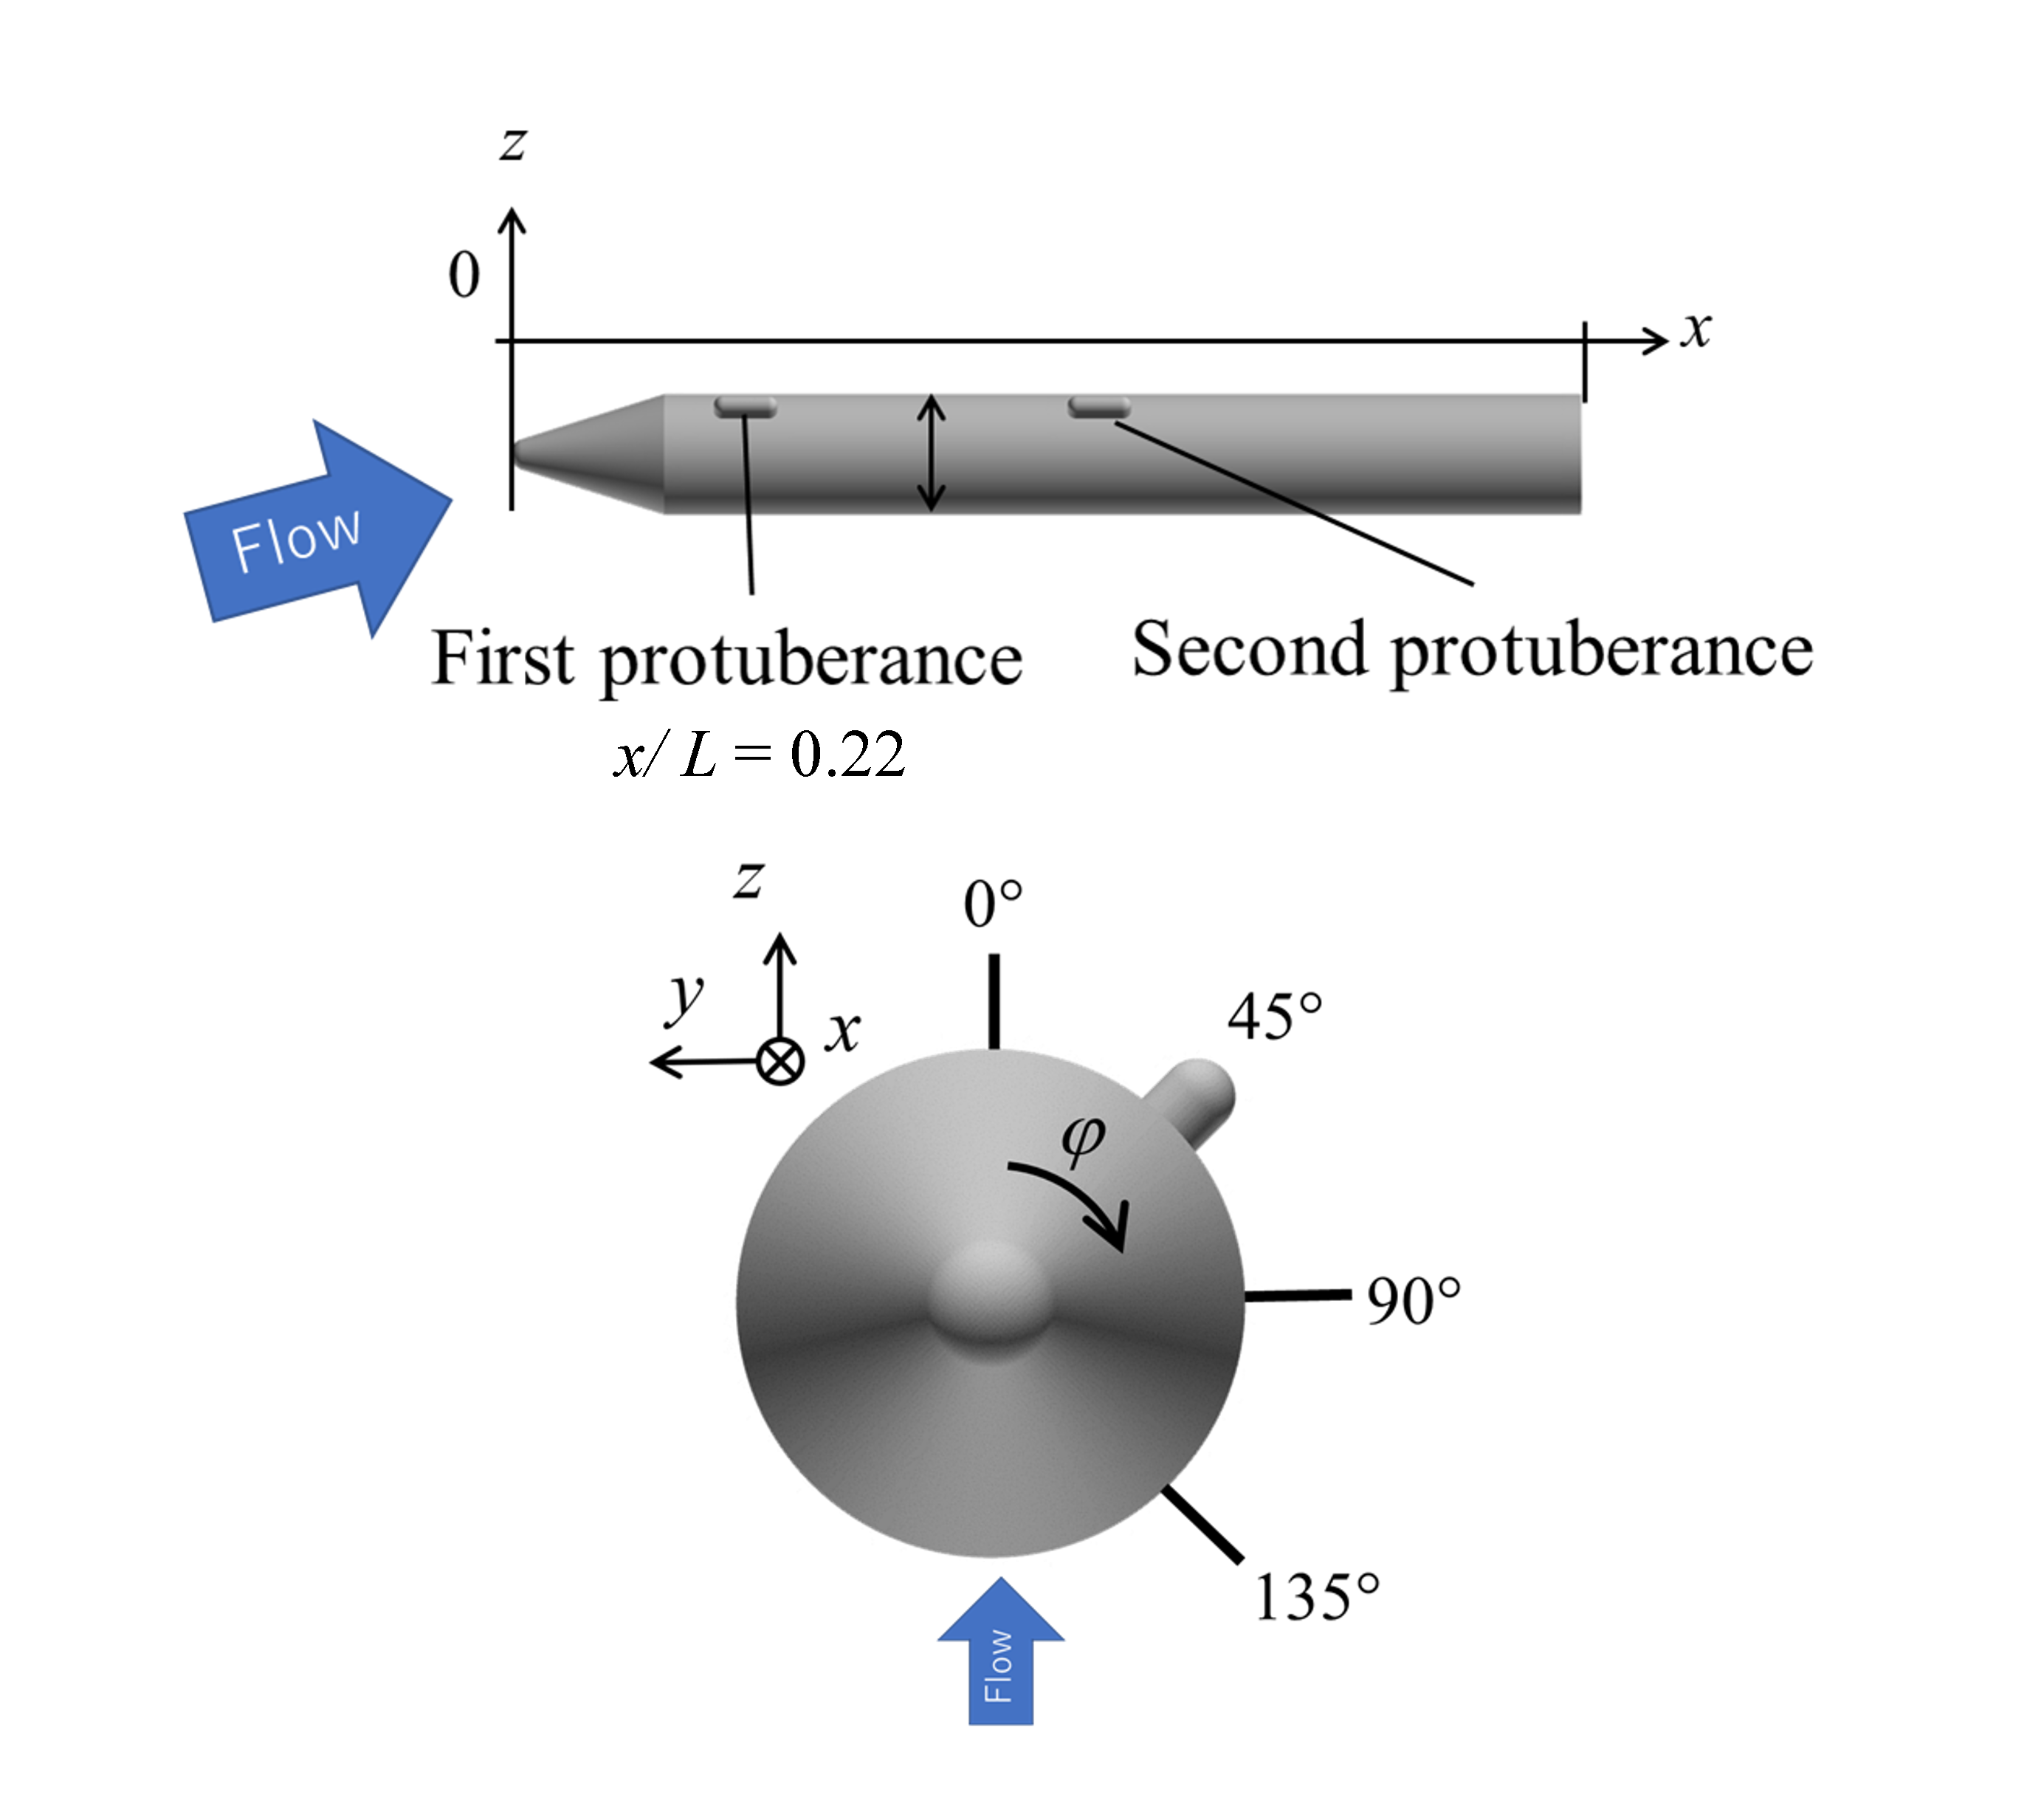
Fig.1: Configuration and protuberance positions
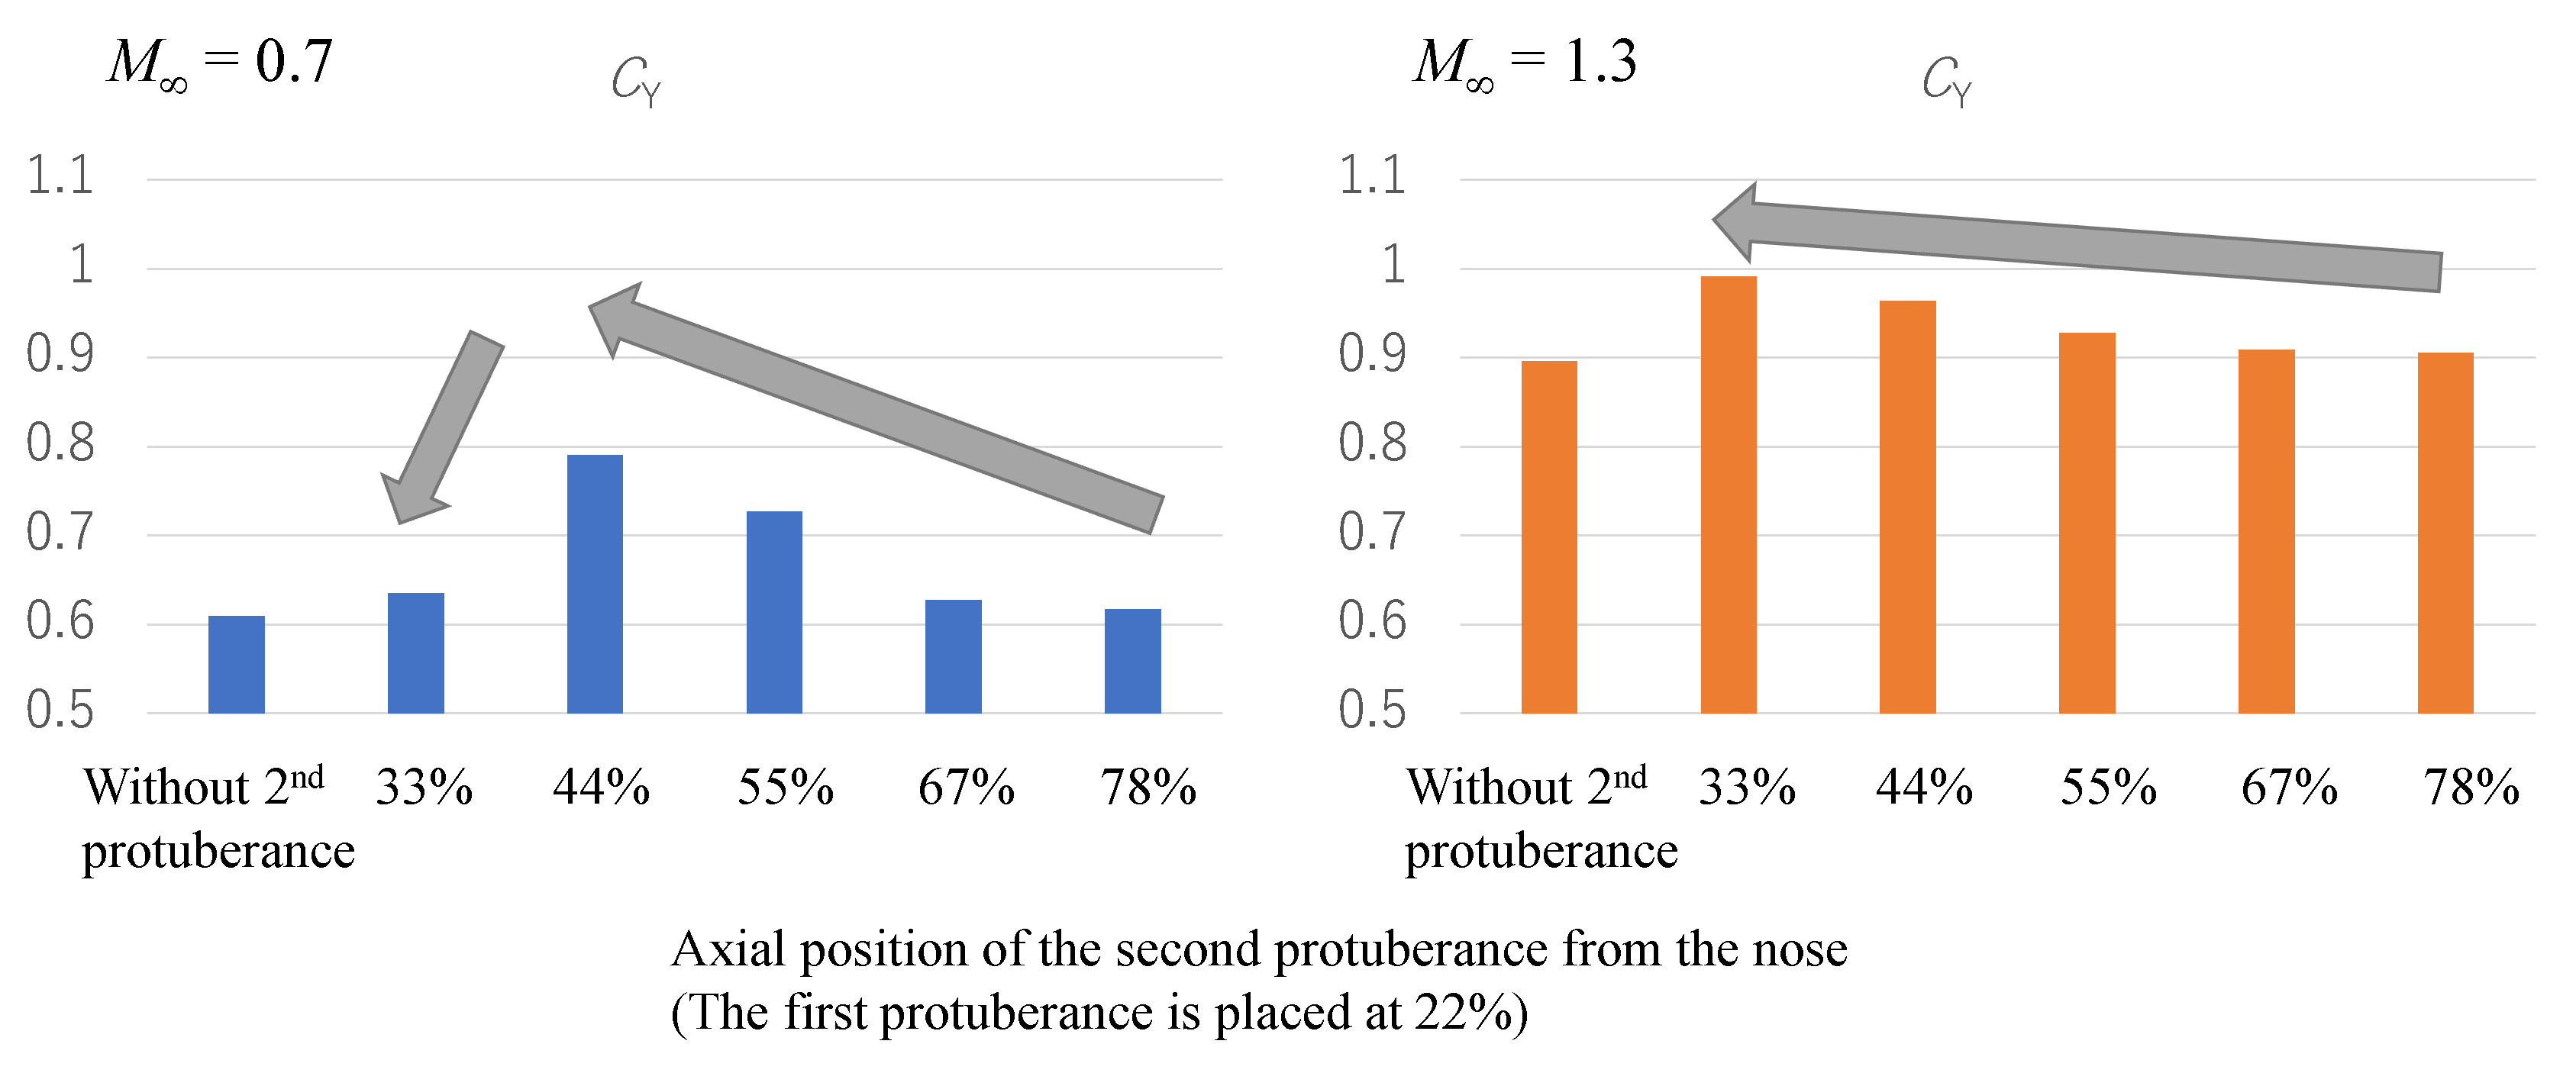
Fig.2: Side force coefficient vs. Axial position of the second protuberance from the nose

Fig.3: Vorticity distribution for the second protuberance position 55% from the nose (Mach 0.7)

Fig.4: Vorticity distribution for the second protuberance position 33% from the nose (Mach 0.7)
Publications
- Oral Presentations
Shogo Motoki, Motoki Magara, Kazuki Nimura, Keiichi Kitamura, Satoshi Nonaka, "Transonic Wind Tunnel Test of Effect of Protuberance Size on Side Force Characteristics of Slender Body"Dynamics Symposium of Space Navigation, ISAS, JAXA, Japan, December 13, 2022.
Usage of JSS
Computational Information
- Process Parallelization Methods: MPI
- Thread Parallelization Methods: N/A
- Number of Processes: 96 - 512
- Elapsed Time per Case: 8 Hour(s)
JSS3 Resources Used
Fraction of Usage in Total Resources*1(%): 0.03
Details
Please refer to System Configuration of JSS3 for the system configuration and major specifications of JSS3.
| System Name | CPU Resources Used(Core x Hours) | Fraction of Usage*2(%) |
|---|---|---|
| TOKI-SORA | 567694.93 | 0.02 |
| TOKI-ST | 40060.54 | 0.04 |
| TOKI-GP | 0.00 | 0.00 |
| TOKI-XM | 0.00 | 0.00 |
| TOKI-LM | 14658.06 | 0.98 |
| TOKI-TST | 0.00 | 0.00 |
| TOKI-TGP | 0.00 | 0.00 |
| TOKI-TLM | 0.00 | 0.00 |
| File System Name | Storage Assigned(GiB) | Fraction of Usage*2(%) |
|---|---|---|
| /home | 428.67 | 0.39 |
| /data and /data2 | 46100.00 | 0.36 |
| /ssd | 203.33 | 0.03 |
| Archiver Name | Storage Used(TiB) | Fraction of Usage*2(%) |
|---|---|---|
| J-SPACE | 28.18 | 0.12 |
*1: Fraction of Usage in Total Resources: Weighted average of three resource types (Computing, File System, and Archiver).
*2: Fraction of Usage:Percentage of usage relative to each resource used in one year.
ISV Software Licenses Used
| ISV Software Licenses Used(Hours) | Fraction of Usage*2(%) | |
|---|---|---|
| ISV Software Licenses(Total) | 1001.12 | 0.70 |
*2: Fraction of Usage:Percentage of usage relative to each resource used in one year.
JAXA Supercomputer System Annual Report February 2022-January 2023