
Computational Study on Aerodynamic Characteristics of Reusable Slender Body Configurations
JAXA Supercomputer System Annual Report February 2021-January 2022
Report Number: R21EACA12
Subject Category: JSS Inter-University Research
- Responsible Representative: Keiichi Kitamura, Associate Professor, Yokohama National University
- Contact Information: Tomohiro Mamashita(mamashita-tomohiro-nj@ynu.jp)
- Members: Keiichi Kitamura, Tomohiro Mamashita
Abstract
In this study, we work on predicting aerodynamic characteristics of the "RV-X", which is an experimental vehicle planned for flight tests. We conducted wind tunnel tests and numerical analysis supposing the low-speed flow during the return flight. The results of the numerical calculations were validated by comparing them with the data of the wind tunnel tests. For the numerical analysis, we focused on how the difference in Reynolds number between the wind tunnel test and the actual flight test affects the flow field, and performed calculations at each Reynolds number. We also investigated the differences between these flow fields by visualizing the results of the calculations.
Reference URL
N/A
Reasons and benefits of using JAXA Supercomputer System
-Objective: To clarify the mechanism of the difference between a wind tunnel test model and an actual vehicle for a slender object such as a reusable rocket, and to provide knowledge for actual flight.
-Necessity: In numerical analysis on the scale of actual vehicles with large Reynolds numbers, the number of grid points required to properly resolve the boundary layer also increases. Therefore, large-scale parallel computation is indispensable to reduce the huge computation time.
-Application: JSS2 and JSS3 have been used because it is necessary to significantly reduce the computation time for large-scale calculations.
Achievements of the Year
We conducted the numerical calculations assuming the wind tunnel test and actual flight test of the reusable experimental rocket "RV-X". Fig. 1 shows the computational grid of the actual flight scale. Fig. 2 shows a plot of the pitching moment coefficient on the wind tunnel test and numerical calculations for wind tunnel scale and actual flight scale. This results indicate that the pitching moment coefficient on the actual flight scale is larger than that of the wind tunnel scale at an angle of attack of 90 degrees. Fig. 3 shows the surface pressure coefficient distributions and surface streamlines. From this figure, we can see that there is deference in the tendency of the streamlines between the wind tunnel scale and actual flight scale. Additionally, in the actual flight scale, a low-pressure region was formed around the nose. For this reason, the pitching moment coefficient of the actual flight scale at an angle of attack of 90 degrees increased. The flow in the actual flight scale is difficult to separate because the Reynolds number is large. Therefore, the flow field around the nose changed significantly (Fig. 4).
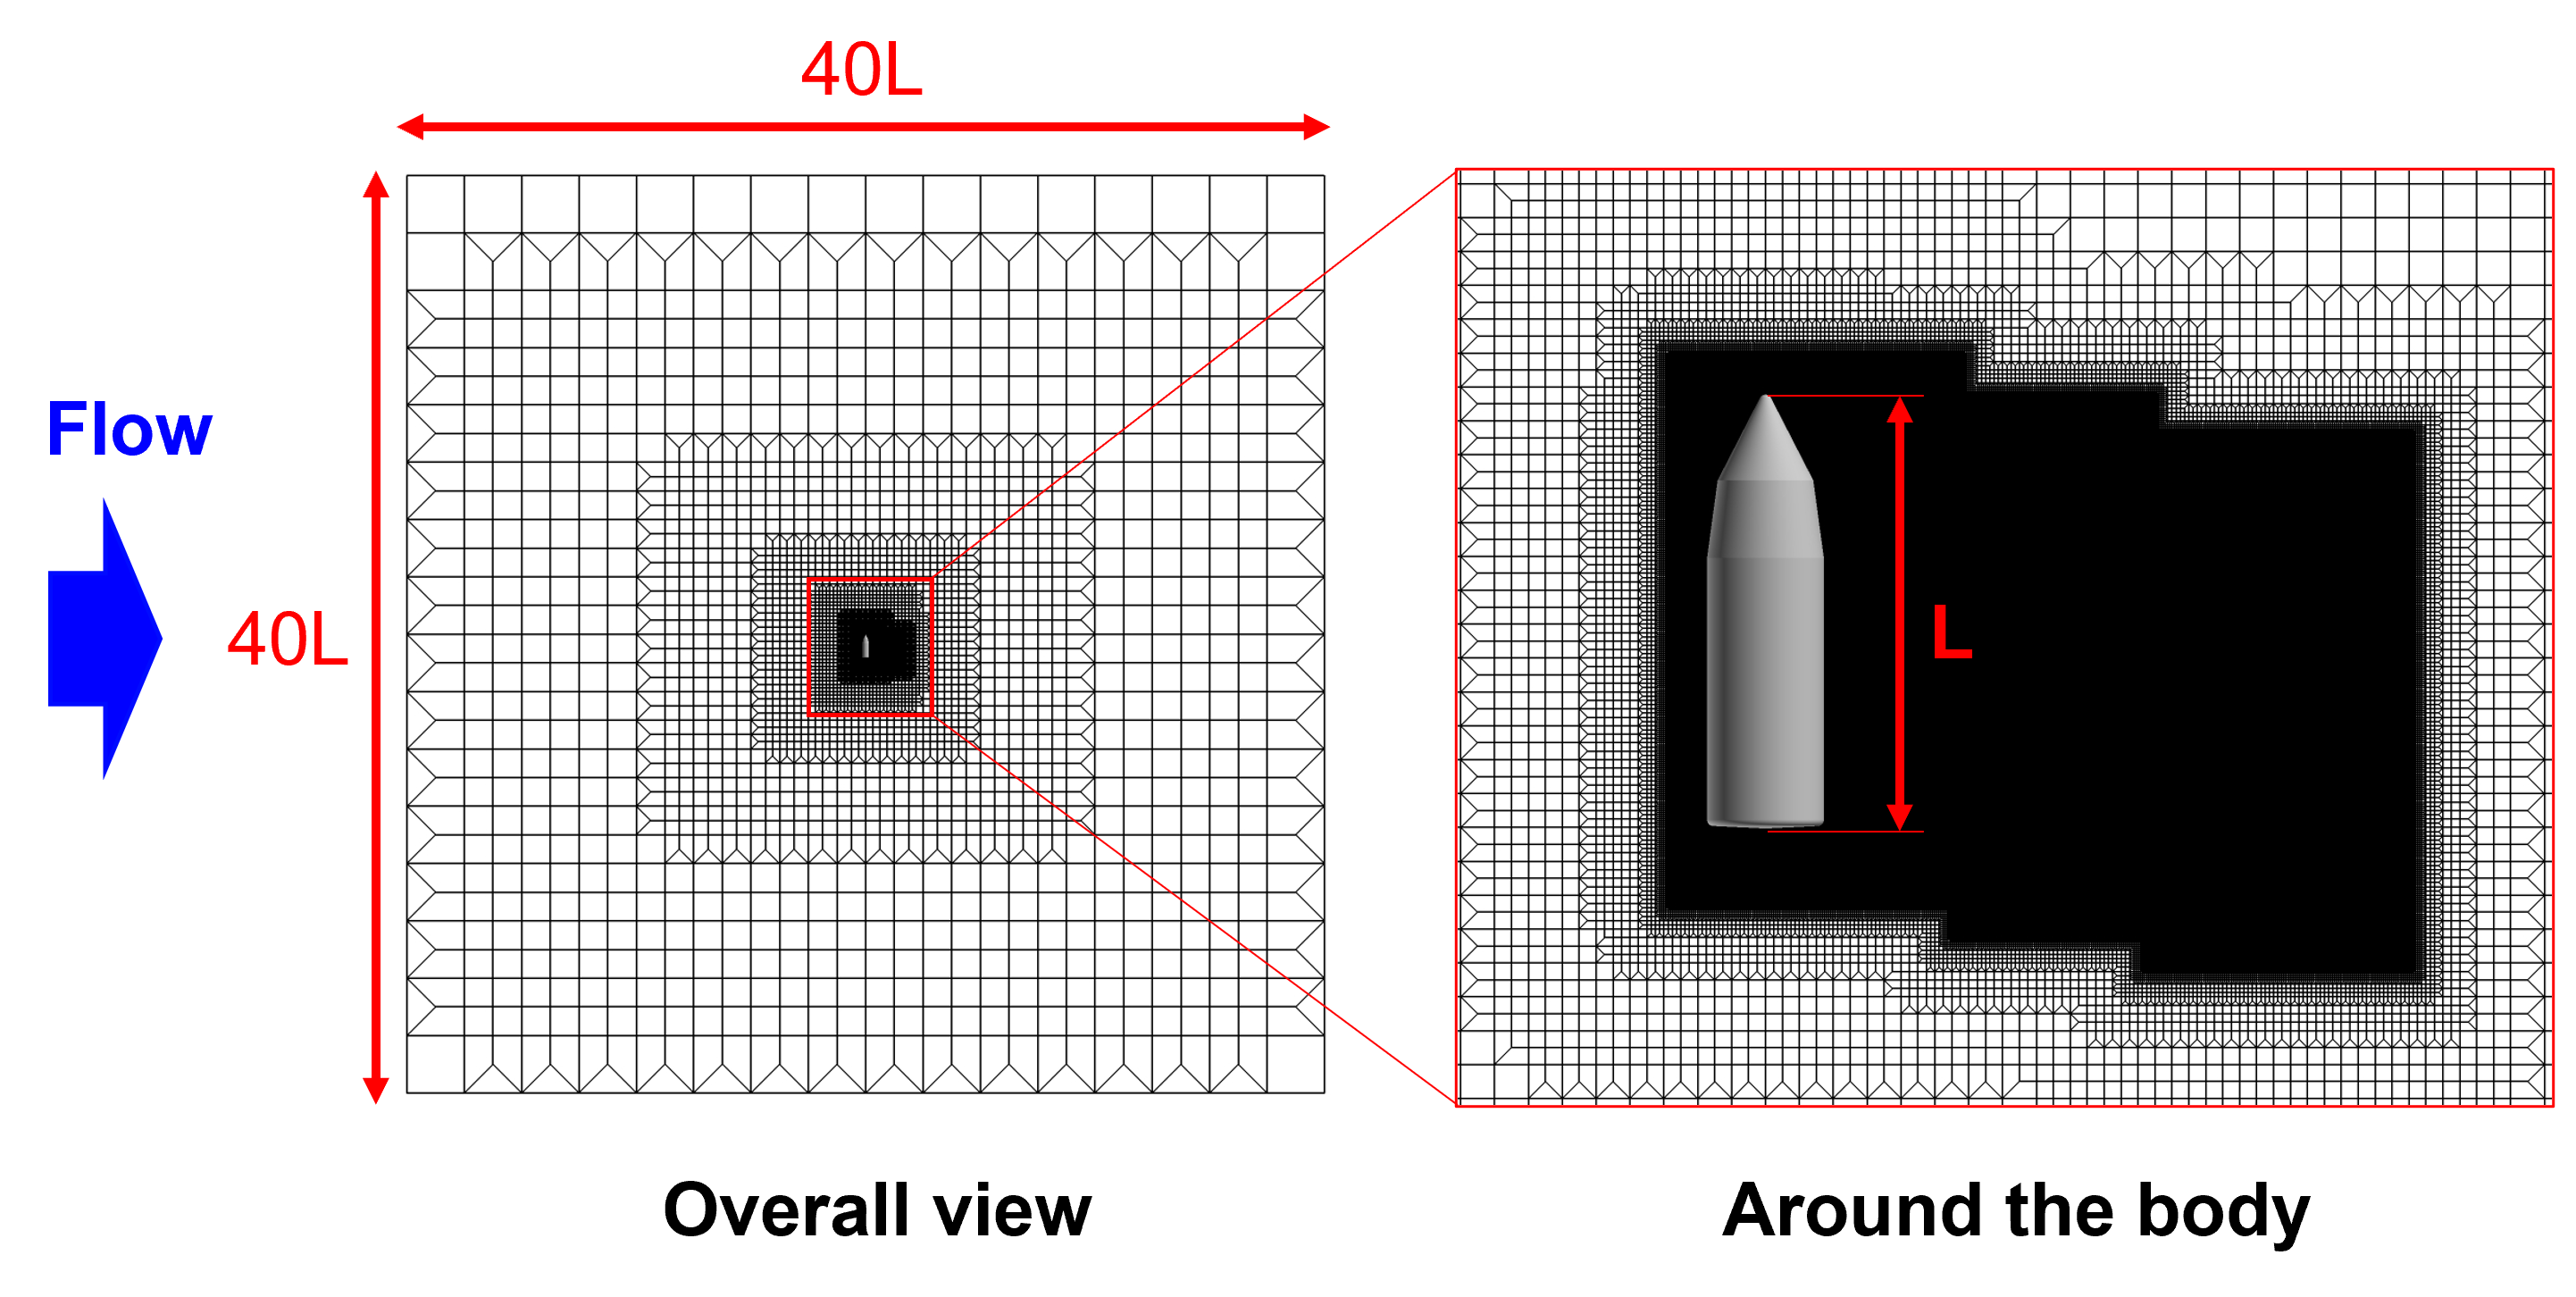
Fig.1: Computational grid.
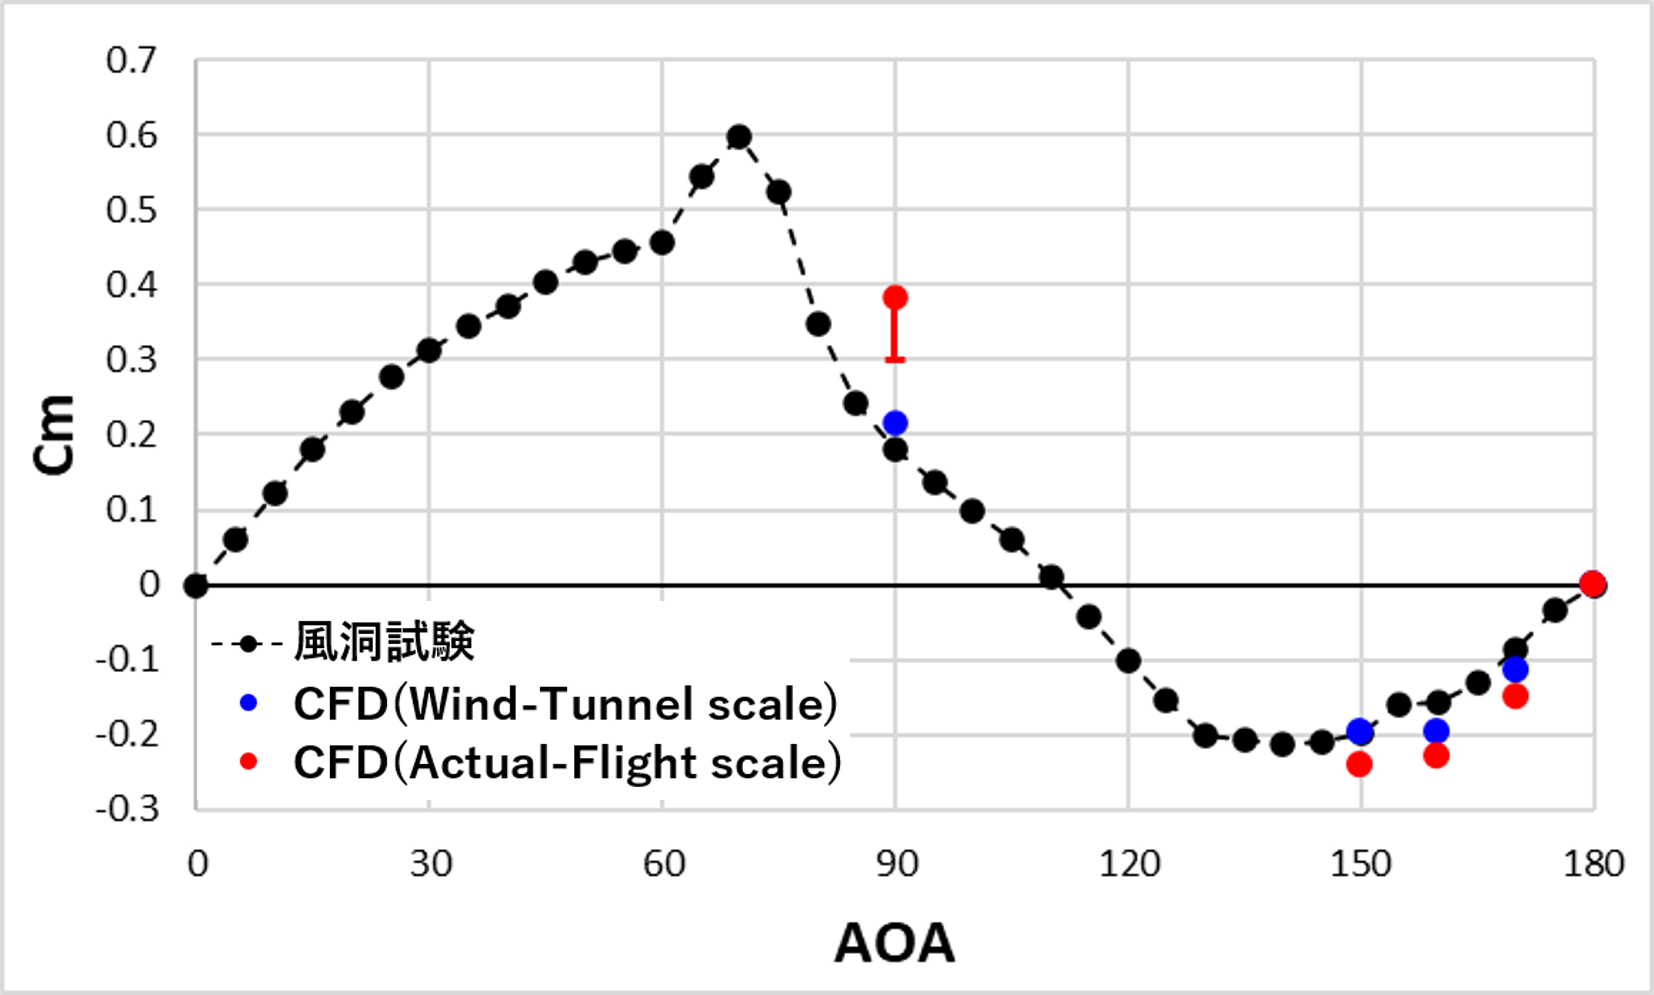
Fig.2: Pitching moment characteristics.
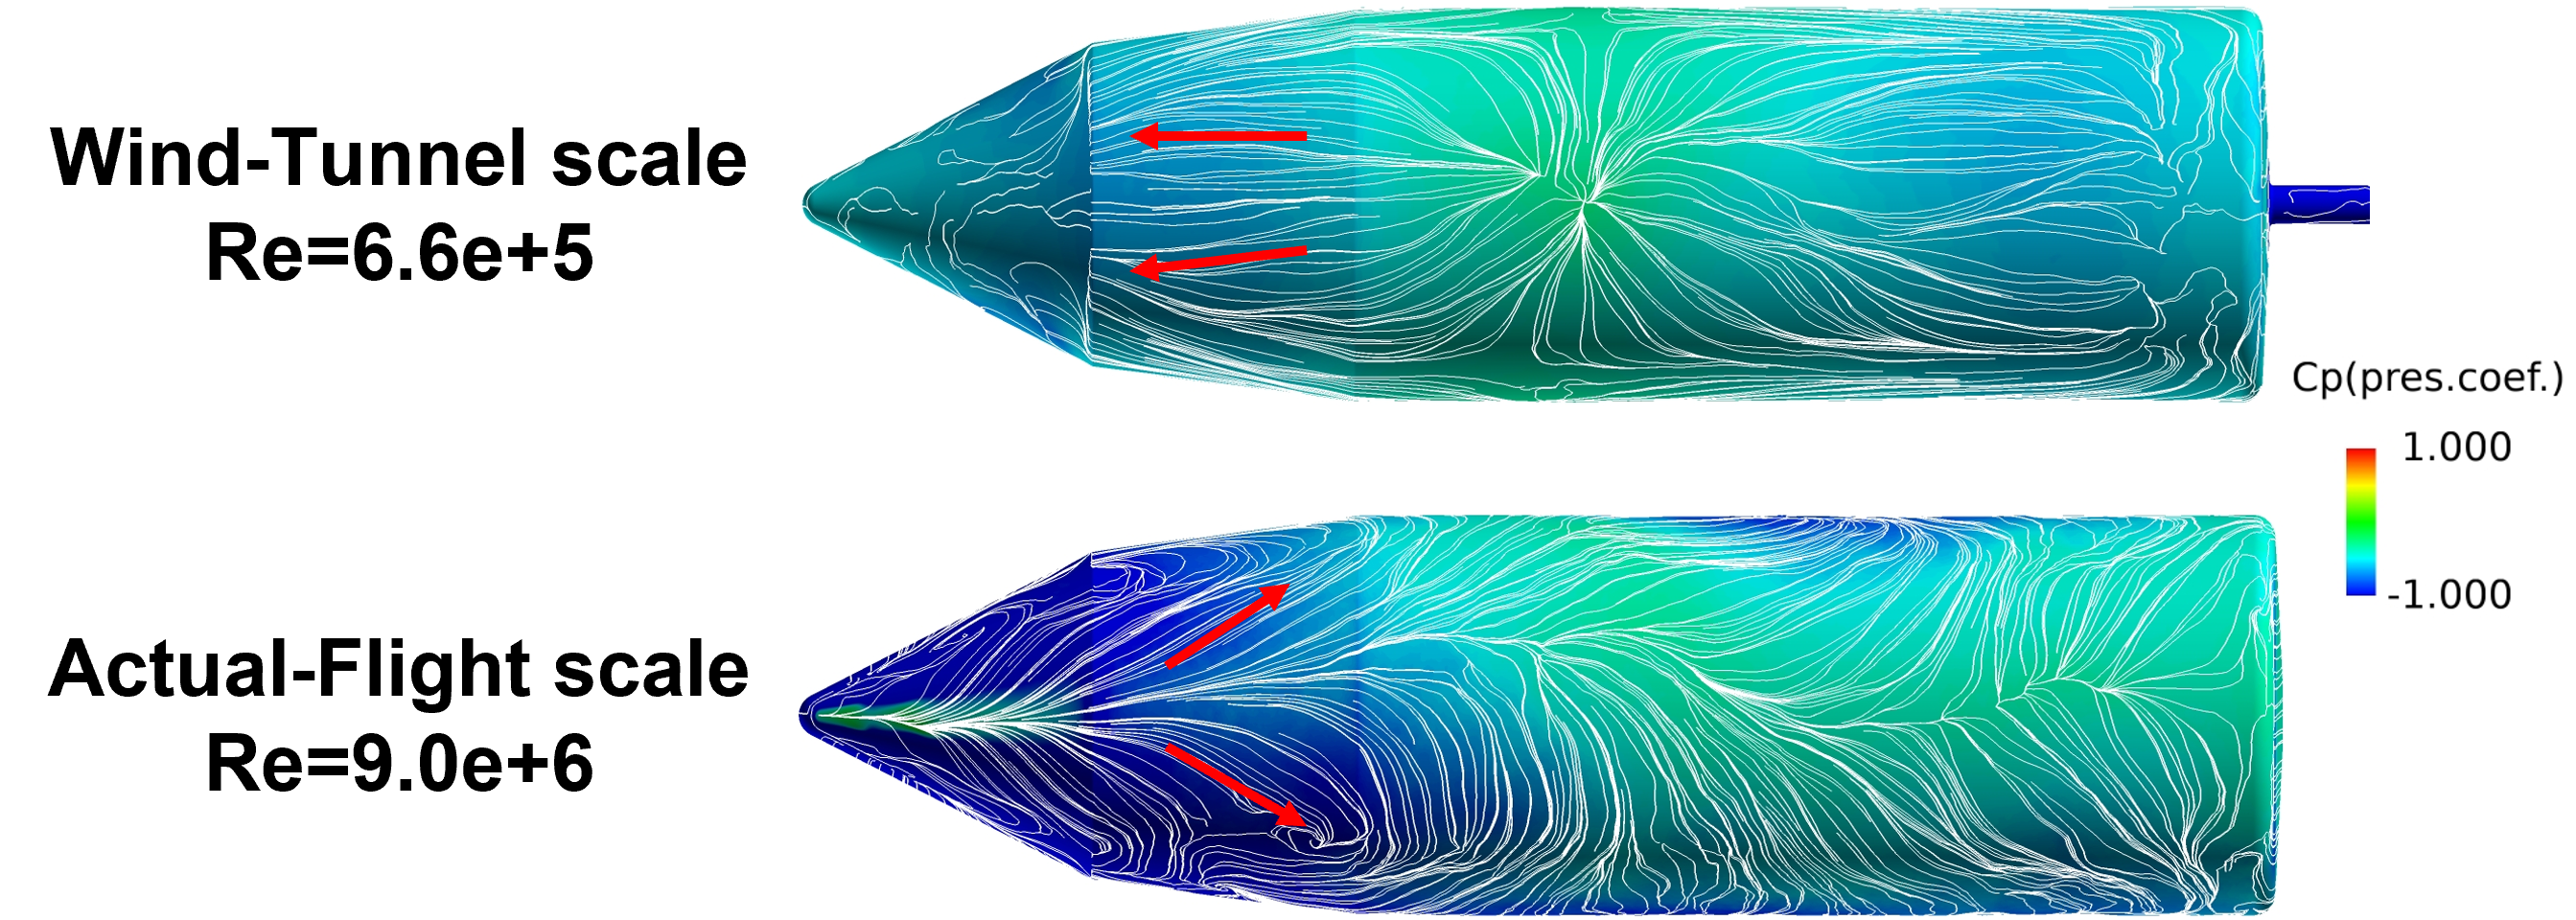
Fig.3: Surface pressure distributions and surface streamlines of the wind tunnel scale and actual flight scale.

Fig.4: Q value isosurfaces near the nose of the wind tunnel scale and actual flight scale.
Publications
- Oral Presentations
-Tomohiro Mamashita, Tomotaro Muto, Keiichi Kitamura, Satoshi Nonaka, "Numerical Analysis on Axial Force Characteristics of Double-Cone Reusable Launch Vehicle at Flight Condition," 53rd Fluid Dynamics Conference/39th Aerospace Numerical Simulation Technology Symposium, Japan, 2021.
-Tomohiro Mamashita, Tomotaro Muto, Keiichi Kitamura, Satoshi Nonaka, "Numerical Analysis on Axial Force Characteristics of Reusable Launch Vehicle during Return Phase," 33rd International Symposium on Space Technology and Science, Japan, 2022.
Usage of JSS
Computational Information
- Process Parallelization Methods: MPI
- Thread Parallelization Methods: N/A
- Number of Processes: 512 - 4096
- Elapsed Time per Case: 50 Hour(s)
JSS3 Resources Used
Fraction of Usage in Total Resources*1(%): 0.29
Details
Please refer to System Configuration of JSS3 for the system configuration and major specifications of JSS3.
| System Name | CPU Resources Used(Core x Hours) | Fraction of Usage*2(%) |
|---|---|---|
| TOKI-SORA | 5547193.60 | 0.27 |
| TOKI-ST | 54529.13 | 0.07 |
| TOKI-GP | 0.00 | 0.00 |
| TOKI-XM | 0.00 | 0.00 |
| TOKI-LM | 120630.66 | 8.99 |
| TOKI-TST | 0.00 | 0.00 |
| TOKI-TGP | 0.00 | 0.00 |
| TOKI-TLM | 0.00 | 0.00 |
| File System Name | Storage Assigned(GiB) | Fraction of Usage*2(%) |
|---|---|---|
| /home | 252.00 | 0.25 |
| /data and /data2 | 15380.00 | 0.16 |
| /ssd | 70.00 | 0.02 |
| Archiver Name | Storage Used(TiB) | Fraction of Usage*2(%) |
|---|---|---|
| J-SPACE | 27.36 | 0.18 |
*1: Fraction of Usage in Total Resources: Weighted average of three resource types (Computing, File System, and Archiver).
*2: Fraction of Usage:Percentage of usage relative to each resource used in one year.
ISV Software Licenses Used
| ISV Software Licenses Used(Hours) | Fraction of Usage*2(%) | |
|---|---|---|
| ISV Software Licenses(Total) | 2734.46 | 1.92 |
*2: Fraction of Usage:Percentage of usage relative to each resource used in one year.
JAXA Supercomputer System Annual Report February 2021-January 2022