
Physics and modeling of compressible thermal turbulent boundary layers
JAXA Supercomputer System Annual Report April 2020-March 2021
Report Number: R20EACA31
Subject Category: JSS Inter-University Research
- Responsible Representative: Soshi Kawai, Professor, Tohoku University
- Contact Information: Ryo Hirai(ryo.hirai.q7@dc.tohoku.ac.jp)
- Members: Soshi Kawai, Yoshiharu Tamaki, Ryo Hirai
Abstract
In this study, near-wall turbulent statistics and structures of compressible turbulent boundary layers on heated and cooled wall are investigated. To evaluate the contributions of local Reynolds number changes within boundary layers caused by wall temperatures to wall turbulence, numerical simulations of a fluid with constant local Reynolds number are conducted and compared with conventional ideal gas cases.
Reference URL
Please refer to ‘Kawai Lab. | Aerospace Engineering, Tohoku University‘.
Reasons and benefits of using JAXA Supercomputer System
Especially in the cooled-wall conditions, the near-wall turbulence becomes small due to the increase of Reynolds number, so that the high-fidelity LES computations require significant computational costs. Therefore, a large-scale parallel computation using a supercomputer, such as JSS2, is mandatory.
Achievements of the Year
In this study, LES of heated/cooled-wall turbulent boundary layers are conducted to investigate the detailed turbulent physics in wall-bounded flows involving wall heat flux. To examine the contributions of the local Reynolds number Re_tau^*to the turbulent statistics, numerical simulations with constant local Reynolds number within the boundary layers are performed, and the obtained results are compared with the conventional ideal gas cases. The constant local Reynolds number is realized by setting the dynamic viscosity to be proportional to the square-root of the fluid density. The numerical settings are following. The Reynolds number and Mach number of incoming flows are set as Re_{theta} = 2,500 for the ideal gas cases, Re_{theta} = 1,300 for the constant Reynolds number cases, and Ma_{infty} = 2.28 for all the cases, respectively (the reference length theta is the momentum thickness of the boundary layer). The sixth-order compact difference scheme is used for the spatial discretization. The time integration method is the third-order TVD Runge-Kutta method. In this study, we consider three different heated/cooled wall temperature conditions, T_w/T_r = 0.5,1.0,2.0 (where T_r is the recovery temperature). The cooled-wall conditions are the cases of T_w/T_r < 1.0, the heated-wall conditions are the cases of T_w/T_r > 1.0, and the quasi-adiabatic-wall condition is the cases of T_w/T_r = 1.0.
Figure 1 shows instantaneous stream-wise velocity fluctuations at y^*=15 within the inner layer length scale box (l^* is the semi-local length scale). In the ideal gas cases (left column), comparing with the quasi-adiabatic case (Fig. 1 (a)), the smaller turbulent structures are observed in the heated case (Fig. 1 (c)), while the opposite trend is observed in the cooled case (Fig. 1 (e)). On the other hand, in the constant Reynolds number cases (right column), there are little differences in the turbulent length scale between the quasi-adiabatic, heated, and cooled cases (Fig. 1 (b), (d), and (f) respectively). The results of Fig. 1 indicate that the thermophysical properties themselves, such as temperature or density, do not affect the changes of the turbulent structures, whereas the local Reynolds number changes have significant contributions to those.
Figure 2 shows the distributions of (a) streamwise velocity fluctuations, (b) mean velocity, and (c,d) derivative of the mean velocity in wall-normal direction, in the conditional-averaged near-wall coherent turbulent structure fields. In Fig. 2(a), the ideal gas cases show the smaller velocity fluctuations for the cooled case and larger for the heated case as is the case with the turbulent structures shown in Fig. 1. On the other hand, in the constant Reynolds number cases, the differences between the adiabatic, heated, and cooled cases are smaller compared with the ideal gas cases. These characteristics of the velocity fluctuation distributions are also observed in the mean velocity (in Fig. 2 (b)) and the first derivative (in Fig.2 (c)). Further, the second derivative in Fig. 2 (d) shows an inflection at y^*=15, which is the same height where the velocity fluctuation peak is observed in Fig. 2 (a). The results of Fig. 2 indicate the close relationship between the velocity fluctuations (i.e., turbulent structures) and mean velocity. Further, the scaling effects of the constant local Reynolds number are also observed as in Fig. 1. The results of this study suggest that the local Reynolds number is an important scaling parameter for turbulent statistics and structures on heated/cooled turbulent boundary layers.
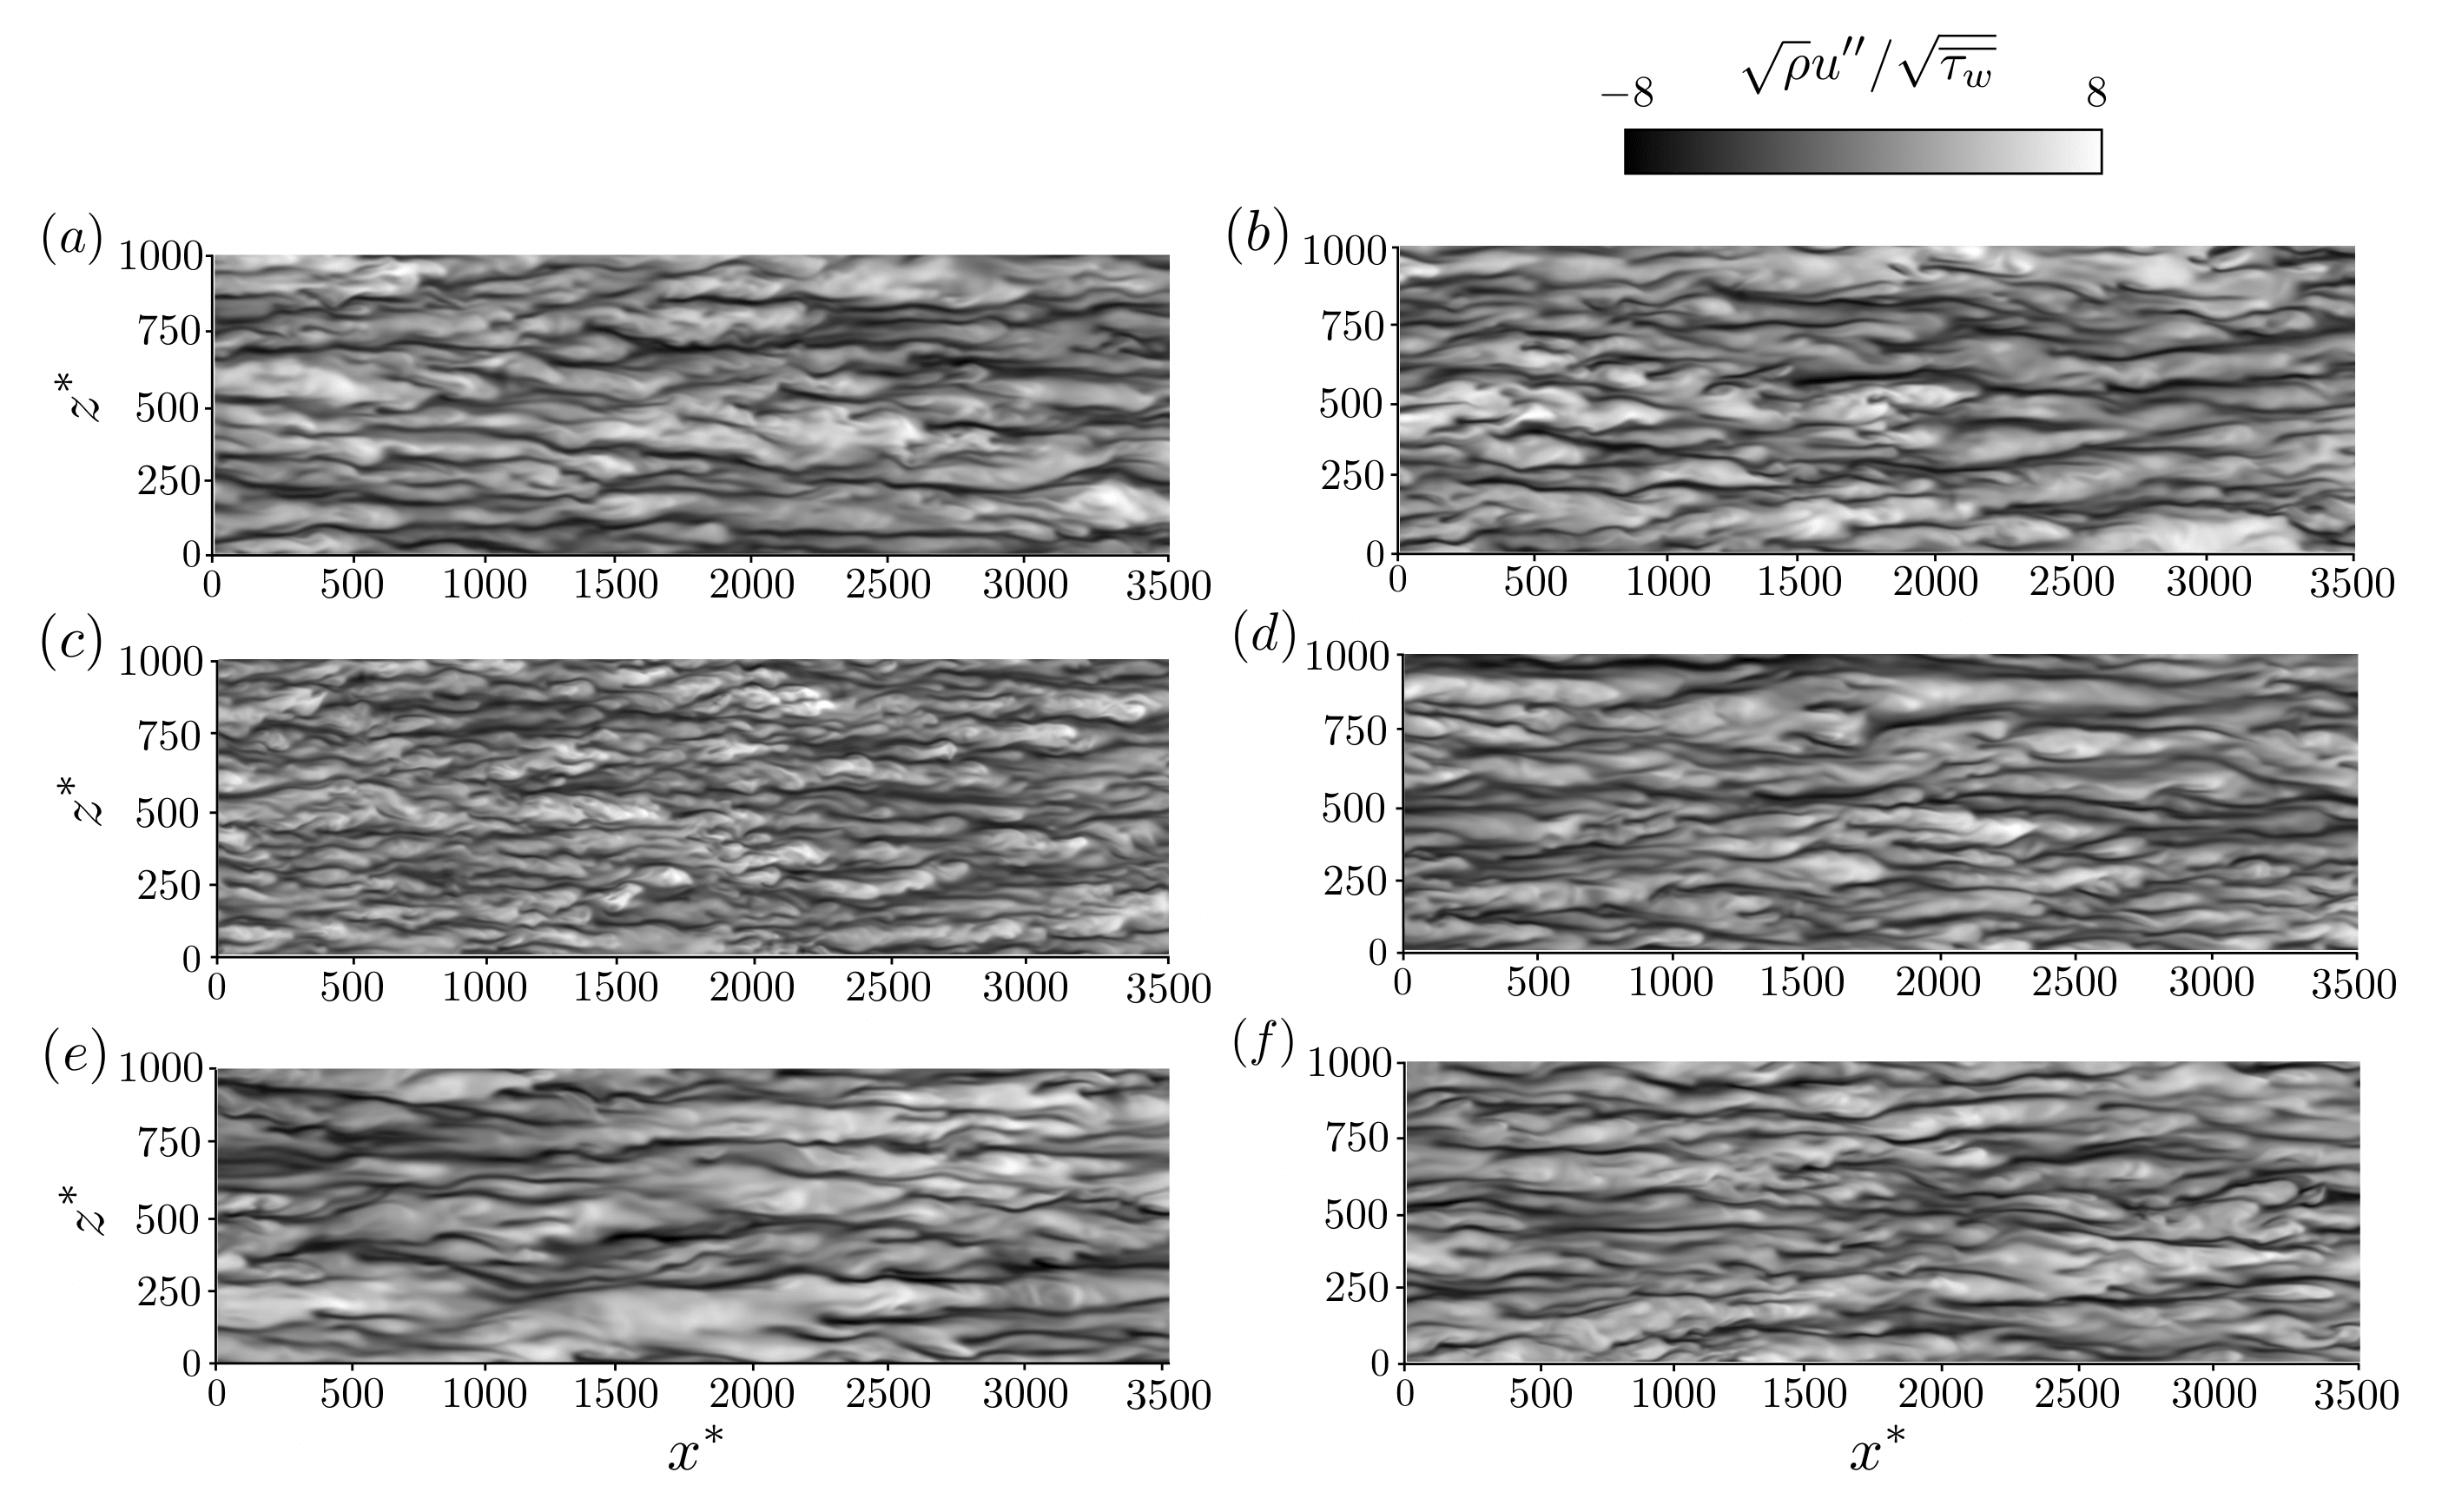
Fig.1: Contours of instantaneous streamwise velocity fluctuations at y^*=15. Left column, ideal gas cases; right column, constant Reynolds number cases. (a, b) quasi-adiabatic, (c, d) heated, (e, f) cooled.
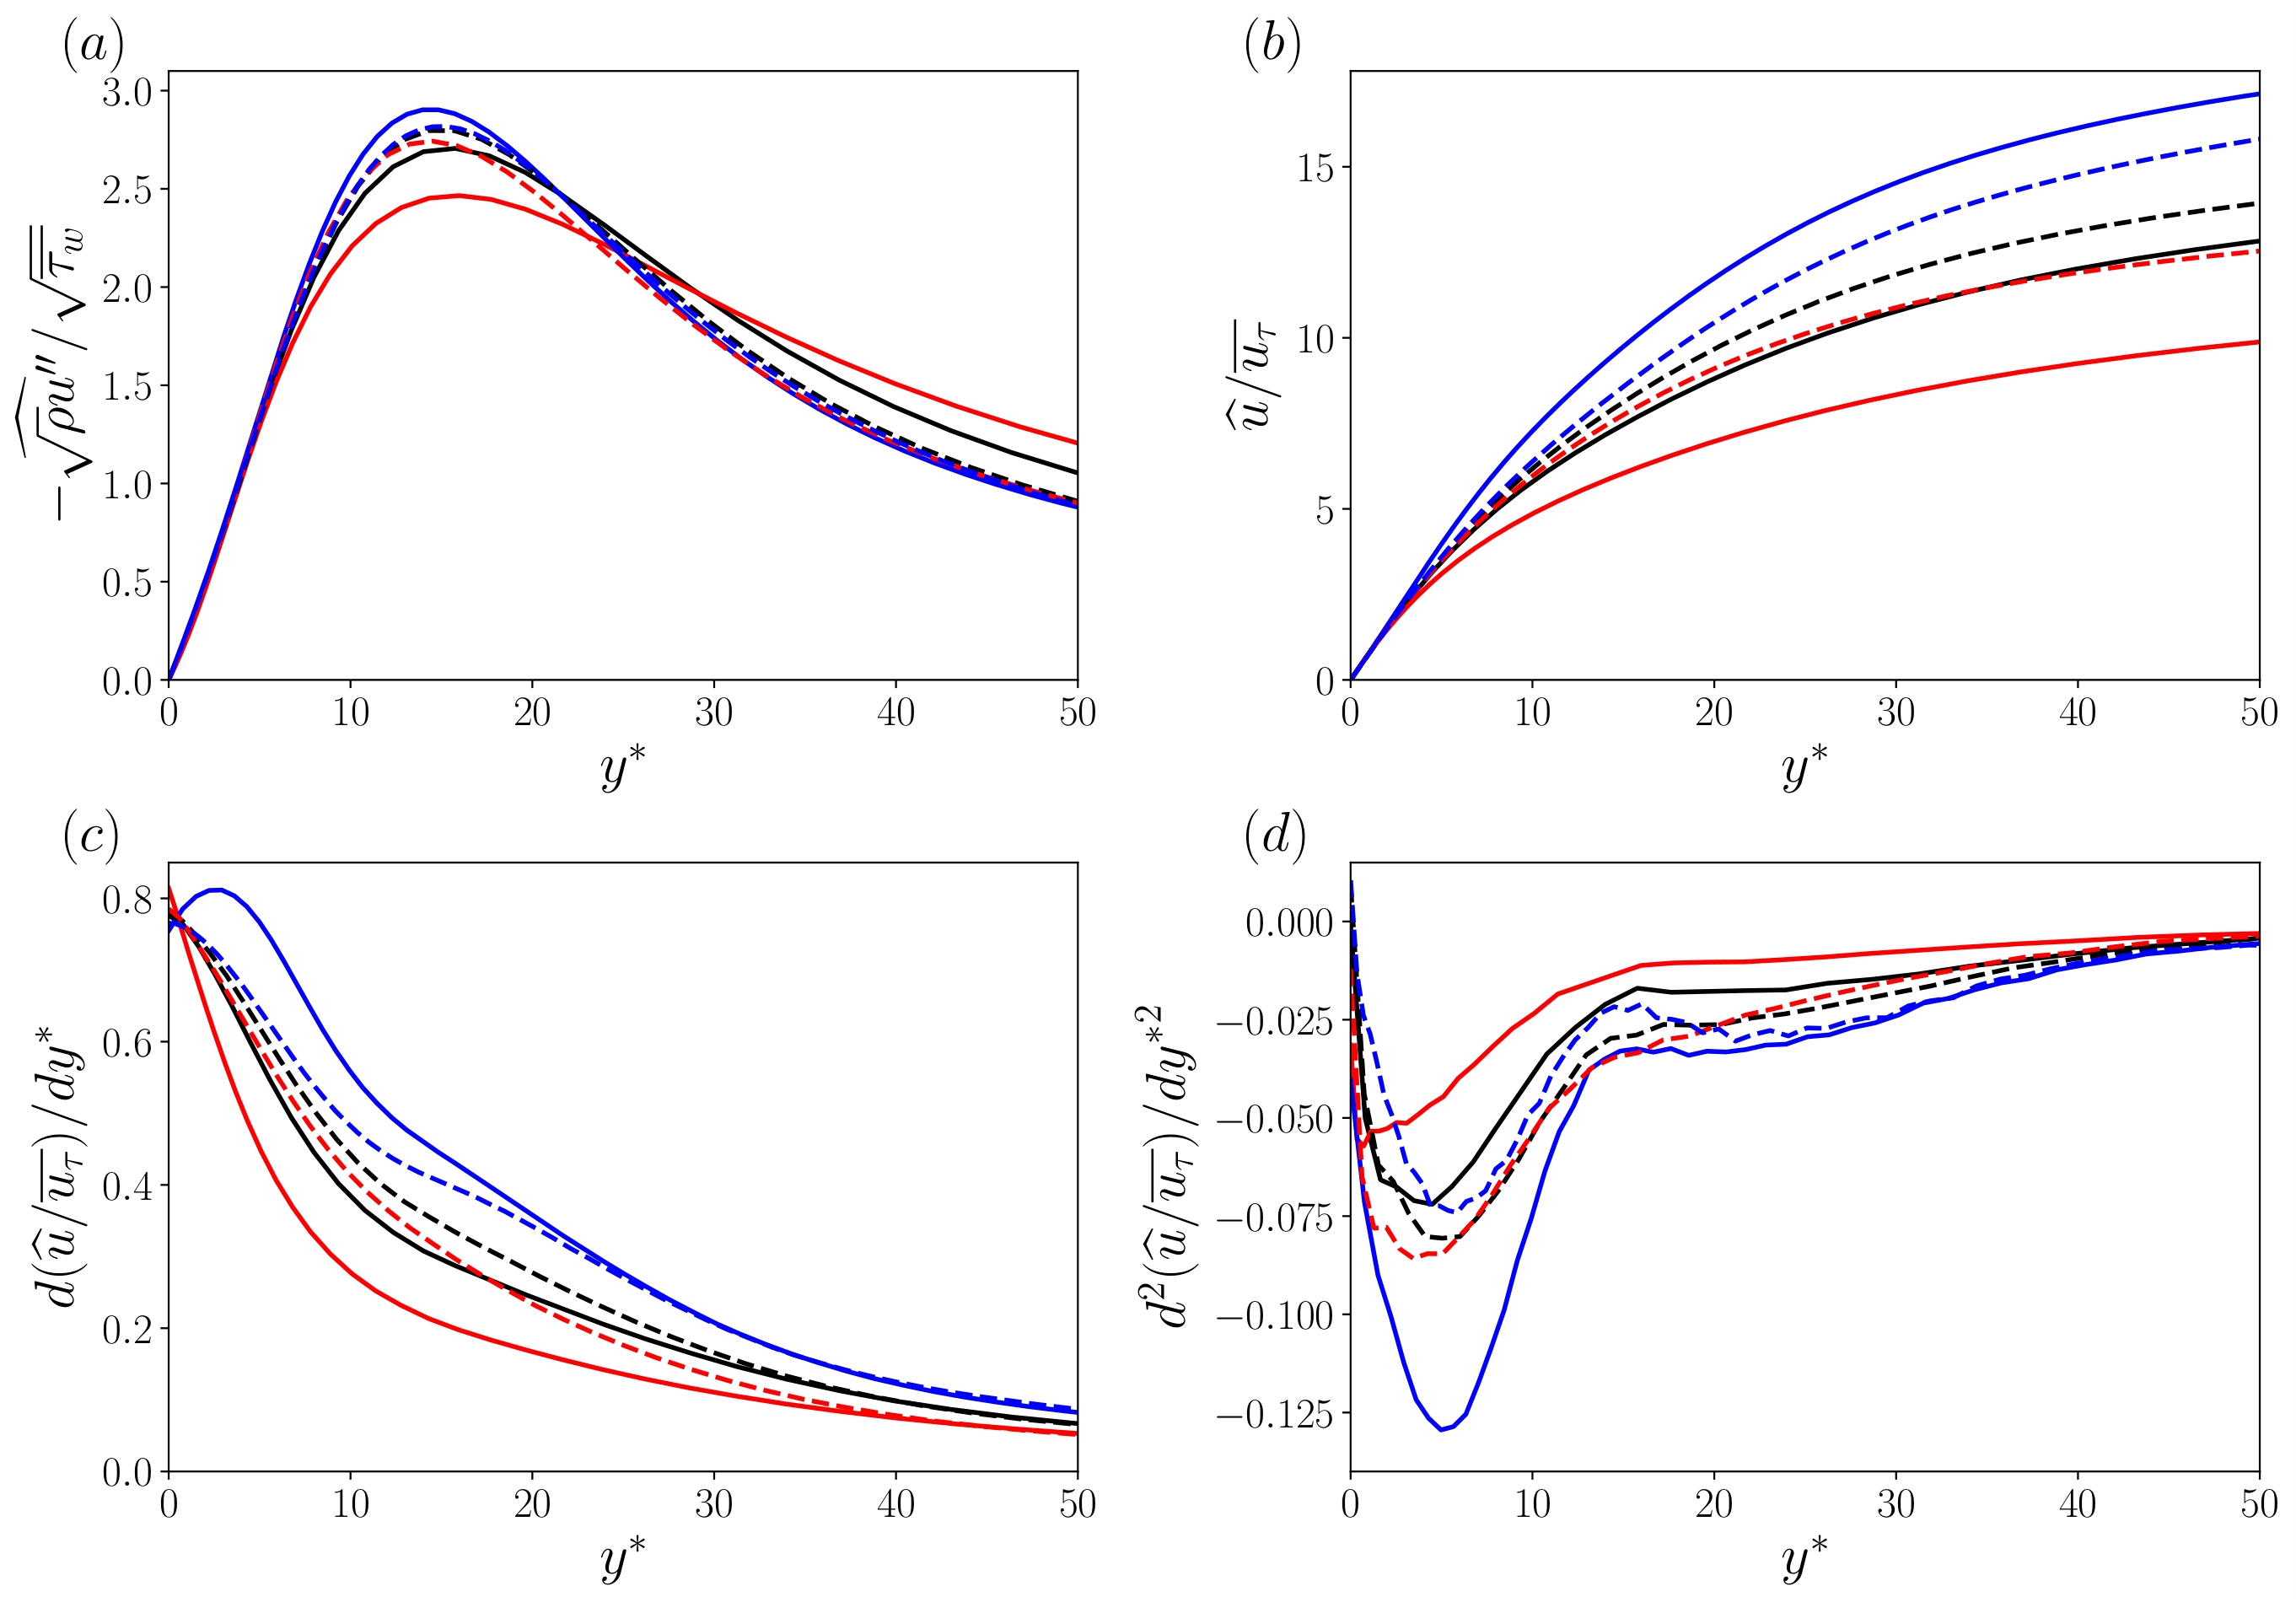
Fig.2: Distributions of (a) velocity fluctuation, (b) mean velocity, (c) first derivative, and (d) second derivative on conditional-averaged near-wall turbulent structure fields. Solid lines, ideal gas cases; dashed lines, constant Reynolds number cases. Black, quasi-adiabatic; red, heated; blue, cooled.
Publications
– Peer-reviewed papers
R. Hirai, R. Pecnik, S. Kawai, “Semi-local Reynolds number’s effects in scaling turbulent statistics for wall heated/cooled supersonic turbulent boundary layers”, Physical Review Fluids (to be submitted)
– Oral Presentations
R. Hirai, R. Pecnik, S. Kawai, “Non-dimensional parameter in turbulent boundary layer phenomena with heated/cooled wall”, 34th CFD symposium
Usage of JSS
Computational Information
- Process Parallelization Methods: MPI
- Thread Parallelization Methods: OpenMP
- Number of Processes: 1020 – 1760
- Elapsed Time per Case: 120 Hour(s)
Resources Used(JSS2)
Fraction of Usage in Total Resources*1(%): 0.11
Details
Please refer to System Configuration of JSS2 for the system configuration and major specifications of JSS2.
| System Name | Amount of Core Time(core x hours) | Fraction of Usage*2(%) |
|---|---|---|
| SORA-MA | 623,377.95 | 0.12 |
| SORA-PP | 0.00 | 0.00 |
| SORA-LM | 0.00 | 0.00 |
| SORA-TPP | 0.00 | 0.00 |
| File System Name | Storage Assigned(GiB) | Fraction of Usage*2(%) |
|---|---|---|
| /home | 290.15 | 0.27 |
| /data | 13,029.51 | 0.25 |
| /ltmp | 2,781.72 | 0.24 |
| Archiver Name | Storage Used(TiB) | Fraction of Usage*2(%) |
|---|---|---|
| J-SPACE | 0.00 | 0.00 |
*1: Fraction of Usage in Total Resources: Weighted average of three resource types (Computing, File System, and Archiver).
*2: Fraction of Usage:Percentage of usage relative to each resource used in one year.
Resources Used(JSS3)
Fraction of Usage in Total Resources*1(%): 0.01
Details
Please refer to System Configuration of JSS3 for the system configuration and major specifications of JSS3.
| System Name | Amount of Core Time(core x hours) | Fraction of Usage*2(%) |
|---|---|---|
| TOKI-SORA | 0.00 | 0.00 |
| TOKI-RURI | 0.00 | 0.00 |
| TOKI-TRURI | 0.00 | 0.00 |
| File System Name | Storage Assigned(GiB) | Fraction of Usage*2(%) |
|---|---|---|
| /home | 287.16 | 0.20 |
| /data | 9,776.23 | 0.16 |
| /ssd | 105.96 | 0.06 |
| Archiver Name | Storage Used(TiB) | Fraction of Usage*2(%) |
|---|---|---|
| J-SPACE | 0.00 | 0.00 |
*1: Fraction of Usage in Total Resources: Weighted average of three resource types (Computing, File System, and Archiver).
*2: Fraction of Usage:Percentage of usage relative to each resource used in one year.
JAXA Supercomputer System Annual Report April 2020-March 2021