Usage summary of JSS2 in FY2018
JAXA Supercomputer System Annual Report April 2018-March 2019
Resource allocation
Five useage classifications shown in Table 1 are set, and even if JSS2 is very crouded, use is guaranteed up to the allocation rate set for each usage classification.
When JSS2 is vacant, crowded classifications could use resources exceeding the allocation limt, and efforts are made to make effective use of resources.
The allocation results in Fig. 1 shows the result of the overall control by the job scheduler. Specified project use is increasing.
Table 1 Usage classification and allocation
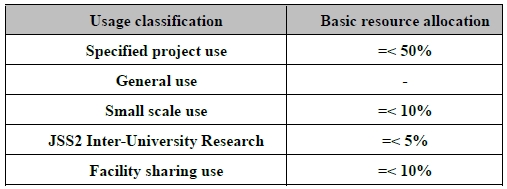
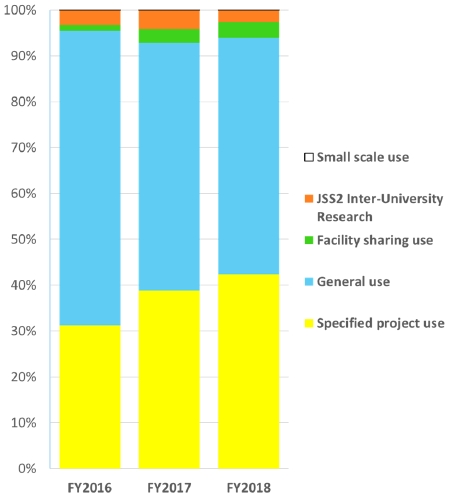
Fig.1 Trend of Usage classification and allocation (FY2016-2018)
Usage result of specified projects
In FY2017 and FY2018, four projects shown in Table 2 were selected as prioritized tasks.
Comparison of FY2017 and FY2018 in Fig.2 shows that the usage results occupying the whole of priority use are increasing, and the H3 project has increased 1.4 times for the four projects. In FY2019, new projects will be selected in light of the new business plan.
Table 2 Specified projects

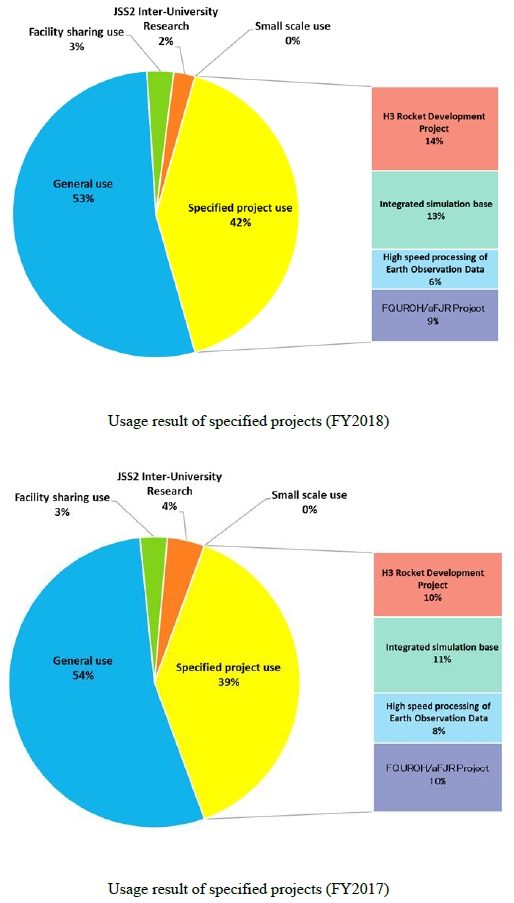
Fig.2 Trend of the Usage of Specified projects (FY2017 and 2018)
Usage result by field
Top application of aeronautical Technology is 45%, but there are many applications of space related fields and research and development. Contributing to external contributions such as contract research, facility sharing, JSS2 Inter-University Research, and student training (Skill Acquisition System).
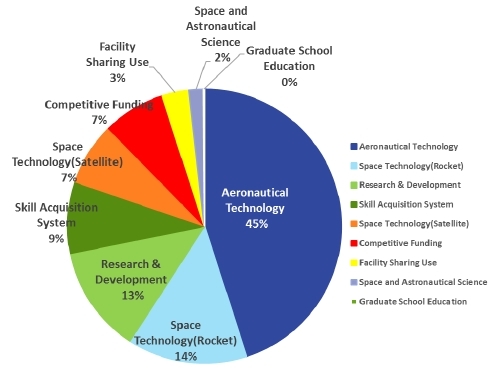
Fig.3 Usage result by field
SORA-MA Operating status
The occupancy rate steadily increased from FY2016 to FY2018, and as of March 2019, 97.38%.
The number of users also expanded to 759 in 2018 compared with 667 in 2017.
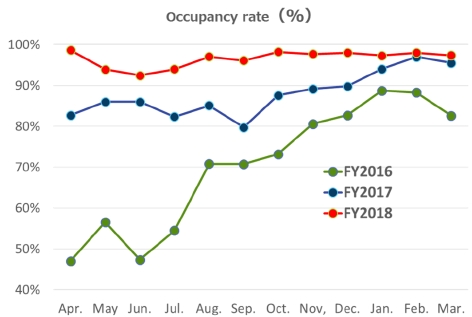
Fig.4 Trend of the occupancy rate (FY2016-2018)
Job trend analysis
The utilization rate is high in the range of 1,000 to 9,999 (54%).
Table 3 Number of Processes per job and core time
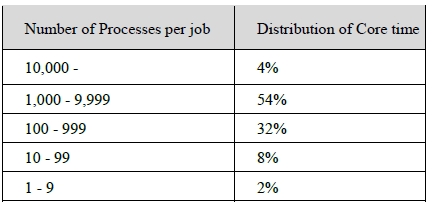
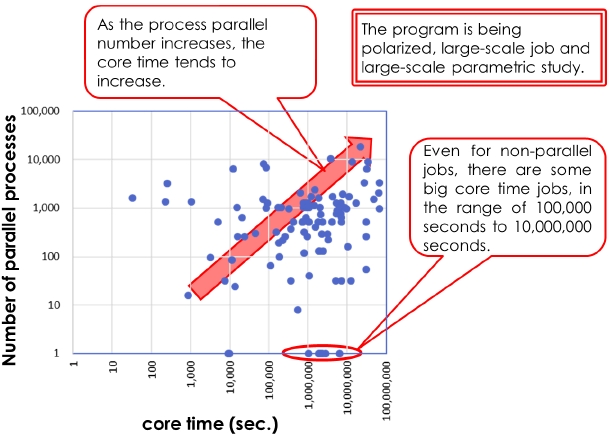
Fig.5 Correlation between number of parallel processes and core time
Attachment 1: JSS2 specifications
Table 4 Major Specifications

Attachment 2: Usage Fee list
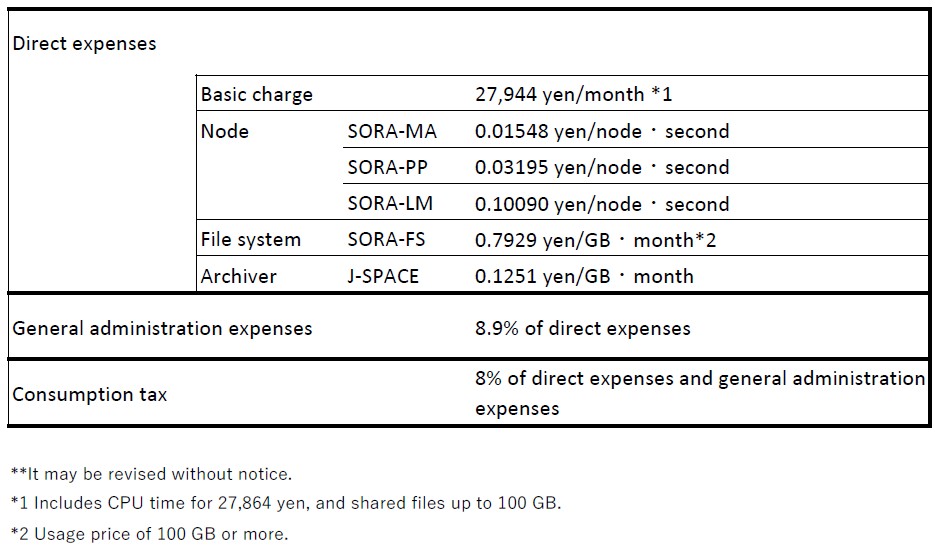
Table 5 Usage Fee list of Facility sharing use
JAXA Supercomputer System Annual Report April 2018-March 2019

