
Research for data assimilation of satellite global rainfall map
JAXA Supercomputer System Annual Report April 2016-March 2017
Report Number: R16E0091
- Responsible Representative: Kinji Furukawa(Space Technology Directorate I, GPM/DPR Project)
- Contact Information: Takuji Kubota(kubota.takuji@jaxa.jp)
- Members: Koji Terasaki, Hisashi Yashiro, Shunji Kotsuki, Takemasa Miyoshi, Kaya Kanemaru
- Subject Category: Space(Satellite utilization)
Abstract
This study aims to improve NWP model forecasts by an effective use of earth-observing satellite data through an advanced data assimilation method. In addition, we also aim to produce a new precipitation product through our global atmospheric data assimilation system.
Goal
This study explores an effective use of satellite data including GPM/DPR through an advanced ensemble data assimilation method for improving numerical weather prediction (NWP) and pioneering a new precipitation product based on an NWP model and satellite observations.
Objective
Please refer 'GPM SITE'.
References and Links
Please refer 'GPM SITE'.
Use of the Supercomputer
The supercomputer is used for the NICAM-LETKF experiments to assimilate satellite observations and to conduct NWP model forecasts.
Necessity of the Supercomputer
The JSS supercomputer is a necessary infrastructure for our study to conduct massive computations for the ensemble-based data assimilation and ensemble atmospheric simulations.
Achievements of the Year
(1) Improving the error covariance inflation approach in NICAM-LETKF
We implemented new adaptive covariance inflation methods to NICAM-LETKF: adaptive-RTPP (Relaxation To Prior Perturbation; Zhang et al. 2004) and adaptive-RTPS (Relaxation To Prior Spread; Whitaker and Hamill 2012). The implemented inflation methods successfully improved analyses and forecasts (Fig. 1).
(2) Long-term NICAM-LETKF experiments
The newly-implemented inflation methods enabled to perform long-term NICAM-LETKF experiments stably for more than 2 years. We explored impacts of assimilating satellite data: GSMaP precipitation and AMSU-A radiances. We found that assimilating AMSU-A radiances gave overall improvements, and additional GSMaP data assimilation provided further improvements, particularly for mixing ratio in the lower troposphere (Fig. 2).
(3) Parameter estimation
We implemented an ensemble-based parameter estimation system into the NICAM-LETKF. Using the parameter estimation system, we estimated a parameter of the large-scale condensation parameterization scheme, so that precipitation forecasts by NICAM have better agreements with the GSMaP data. Using the estimated parameter successfully improved the precipitation forecasts (Fig. 3).
(4) Theoretical study on error-correlated observations
It is known that satellite-derived observations tend to contain correlated errors. We conducted an observing system simulation experiment (OSSE) to estimate the impact of using the non-diagonal observation error covariance R explicitly in data assimilation. Accounting for the full non-diagonal R improved the analyses compared to commonly-used approaches such as assuming diagonal R with inflated observation error variance and with thinned observations (Fig. 4).
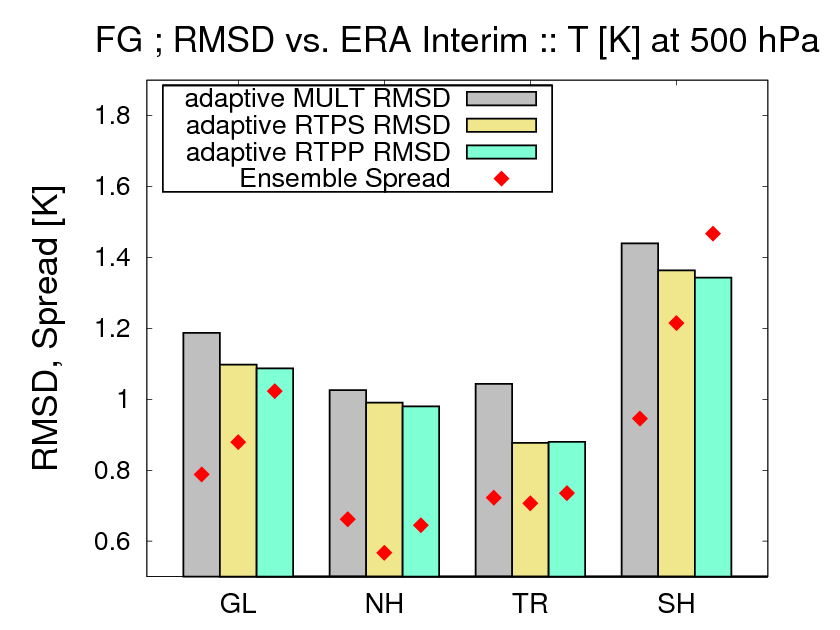
Fig.1:Time-mean background root mean square differences (RMSDs) and ensemble spreads of temperature (K) at 500 hPa relative to the ERA Interim reanalysis for the global (GL), Northern Hemisphere (NH), tropics (TR), and Southern Hemisphere (SH) domains, averaged over a month in August 2014. Grey, yellow, and green bars show the RMSDs of adaptive-MULT, adaptive-RTPS, and adaptive-RTPP, respectively. Red dots indicate the ensemble spreads. Adopted from Kotsuki et al. (2017b,submitted to QJRMS).
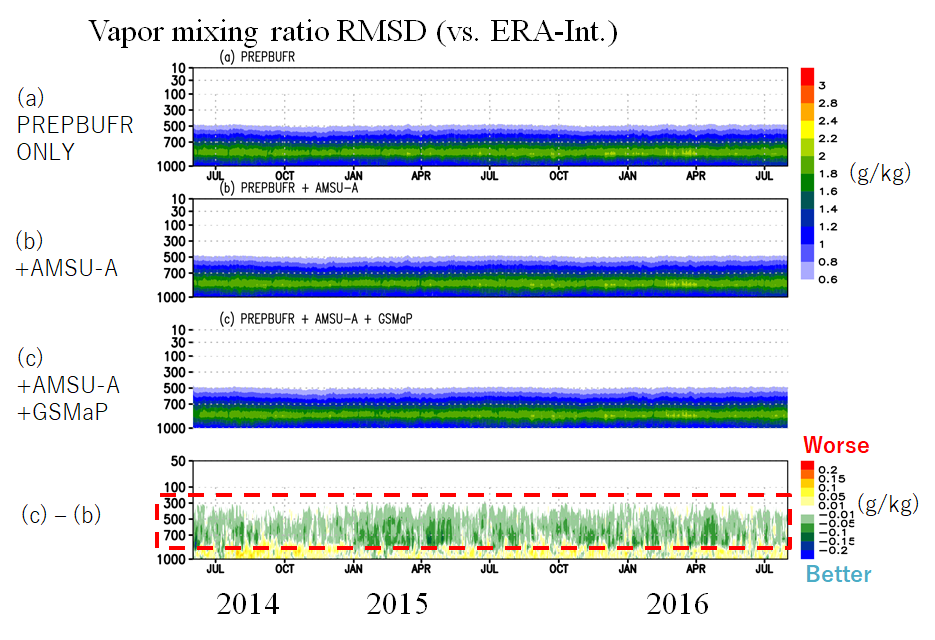
Fig. 2:Time series of the global-mean root mean analysis differences (RMSD) for vapor mixing ratio (g kg-1) relative to the ERA-interim reanalysis. The ordinate indicates vertical levels (hPa). (a) PREPUBUFR only, (b) +AMSU-A, (b) +AMSU-A and GSMaP. The bottom panel shows the difference between (b) and (c), where blue (red) corresponds to improvement (degradation) due to GSMaP data assimilation. Adopted from Terasaki and Miyoshi (2017a,submitted to JMSJ).
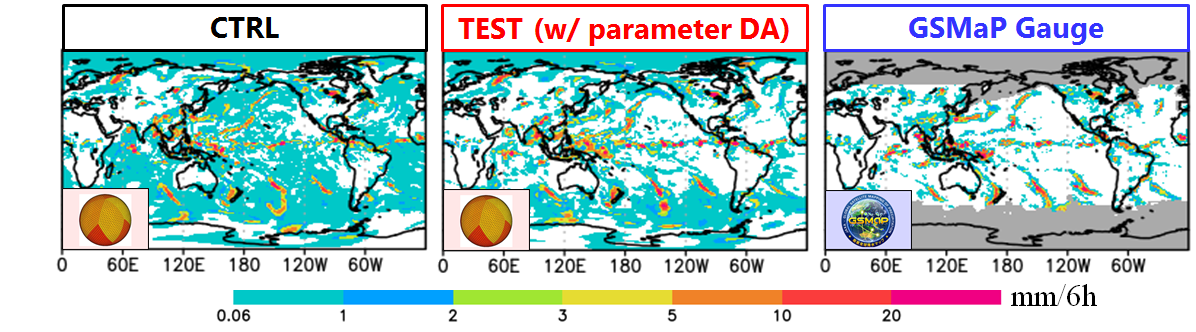
Fig. 3:Global precipitation patterns (mm 6h-1) for (left) control experiment, (center) parameter estimation experiment, and (right) GSMaP_Gauge observation. The gray color denotes missing data. Adopted from Kotsuki et al. (2017c, in preparation).
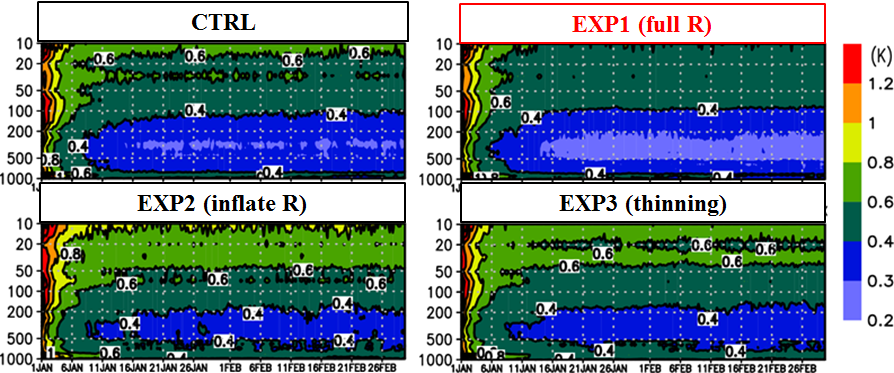
Fig. 4:Analysis root mean analysis errors for temperature (K) in the NICAM-OSSE experiments assimilating error-correlated observations. CTRL assumes the diagonal R. EXP1 accounts for the observation error correlations explicitly (full R). EXP2 assumes the diagonal R but the observation error variances are inflated (inflated diagonal R). EXP3 assumes the diagonal R but the observations are thinned. Adopted from Terasaki and Miyoshi (2017b, in preparation)
Publications
Peer-reviewed articles
1) Kotsuki, S., T. Miyoshi, K. Terasaki, G.-Y. Lien, and E. Kalnay, 2017a: Assimilating the Global Satellite Mapping of Precipitation Data with the Nonhydrostatic Icosahedral Atmospheric Model NICAM. J. Geophys.Res. Atmos., 122, 1-20. doi:10.1002/2016JD025355
Invited lecture
1) 2016/7/6 T. Miyoshi, `Big Data perspective on assimilating dense observations with spatially correlated errors'RMetS/NCAS Conference 2016 High Impact Weather and Climate, Manchester, UK
2) 2016/7/11 T. Miyoshi, `Big Data,supercomputing, and Data Assimilation', Data Assimilation Research Centre Meetings, Reading, UK
3) 2016/7/19 T. Miyoshi, `'Big Data Assimilation': Progress and Plans', ISDA2016, Reading, UK
6) 2017/1/24 T. Miyoshi, K. Terasaki, S. Kotsuki, K. Kondo, T. Honda, G. Y. Lien, Y. Sawada, and K. Okamoto, 'Challenges and Advances in Satellite Data Assimilation: From Vertical Covariance Localization to Every-10-Minute Himawari-8 All-Sky IR Radiances', ,97th AMS Annual Meeting, Seattle, USA
Computational Information
- Parallelization Methods: Hybrid Parallelization
- Process Parallelization Methods: MPI
- Thread Parallelization Methods: Automatic Parallelization
- Number of Processes: 400
- Number of Threads per Process: 4
- Number of Nodes Used: 100
- Elapsed Time per Case (Hours): 10
- Number of Cases: 713
Resources Used
Total Amount of Virtual Cost(Yen): 49,052,567
Breakdown List by Resources
| System Name | Amount of Core Time(core x hours) | Virtual Cost(Yen) |
|---|---|---|
| SORA-MA | 27,698,662.86 | 45,076,854 |
| SORA-PP | 0.06 | 0 |
| SORA-LM | 0.00 | 0 |
| SORA-TPP | 0.00 | 0 |
| File System Name | Storage assigned(GiB) | Virtual Cost(Yen) |
|---|---|---|
| /home | 1,449.59 | 13,673 |
| /data | 410,251.80 | 3,869,918 |
| /ltmp | 9,765.63 | 92,119 |
| Archiving System Name | Storage used(TiB) | Virtual Cost(Yen) |
|---|---|---|
| J-SPACE | 0.00 | 0 |
Note: Virtual Cost=amount of cost, using the unit price list of JAXA Facility Utilization program(2016)
JAXA Supercomputer System Annual Report April 2016-March 2017