
Physics and modeling of compressible thermal turbulent boundary layers
JAXA Supercomputer System Annual Report February 2021-January 2022
Report Number: R21EACA31
Subject Category: JSS Inter-University Research
- Responsible Representative: Soshi Kawai, Professor, Tohoku University
- Contact Information: Ryo Hirai(ryo.hirai.q7@dc.tohoku.ac.jp)
- Members: Soshi Kawai, Ryo Hirai, Shoichi Nasukawa, Yuta Iwatani, Yuji Fujiwara, Atsushi Nakano
Abstract
In this study, we perform wall-modeled large-eddy simulation (wall-modeled LES) of shock wave/turbulent boundary layer interactions with wall heat flux to evaluate the predictability of the wall heating/cooling effects on the shock-induced boundary layer separations. The wall-modeled LES is validated by comparing to the direct numerical simulation (DNS) database in terms of the mean streamwise velocity, skin friction coefficient, and wall heat flux distributions. The wall-modeled LES accurately predicts the qualitative changes of the mean velocity distributions at the separated regions affected by the wall heating/cooling.
Reference URL
Please refer to https://www.klab.mech.tohoku.ac.jp/ .
Reasons and benefits of using JAXA Supercomputer System
Large-scale computations are required to resolve separated turbulent boundary layer flows induced by shock wave/turbulent boundary layer interactions. Also, long integration times are taken to capture unsteady low-frequency shock-wave oscillations. A large-scale parallel computation using JSS3 is appropriate for computing the spatially and temporally large-scale unsteady flow simulations.
Achievements of the Year
In this study, we perform wall-modeled LES of shock wave/turbulent boundary layer interactions with wall heat flux and validate the predictability of wall heating/cooling effects on the separated boundary layer flows by comparing with DNS database. Figure 1 shows the numerical settings of the present simulations. The Reynolds number and Mach number of the incoming flows are set to Re_{theta}=5,000 and M_{infty}=2.28, respectively (the length-scale theta is the momentum thickness of the boundary layer). The incident shock-wave angle is set to beta=32.7 degrees, and the shock is imposed at the upper boundary to impinge onto lower walls at x_sh=35 d0 in the downstream when assuming inviscid wall boundary conditions, where the reference length d0 denotes the representative boundary layer thickness. In this study, we consider three different wall temperature conditions, Tw/Tr=0.5 (cooled), 1.0 (quasi-adiabatic), and 2.0 (heated), where Tr denotes the recovery temperature. In computational domains, the wall temperature is fixed as the quasi-adiabatic-wall condition at incoming regions and transitioned smoothly to the heated- or cooled-wall condition at x_t=8 d0 in the downstream. The sixth-order compact difference scheme is used for the spatial discretization. The time integration method is the third-order three-stage TVD Runge-Kutta method. To capture shock wave robustly with the non-dissipative compact scheme, we use the localized artificial diffusion method [Kawai & Lele (2008)]. Furthermore, the subgrid-scale viscosity is evaluated by the selective mixed scale model. Also, we use the equilibrium wall model that considers the effects of the wall heat flux [see the prior report of this study: R19EACA31].
Figure 2 shows mean streamwise velocity distributions around the boundary layer separation region. In the DNS results (left column), the differences between the wall temperature conditions are observed mainly in the starting point of separation and the separation size. In the heated-wall case (Fig. 2 (c)), the separation point moves upstream, and the separation grows, compared with the quasi-adiabatic-wall case(Fig. 2 (a)). In contrast, the separation point moves downstream, and the separation size shrinks in the cooled-wall case (Fig. 2 (e)). The wall-modeled LES (right column) can qualitatively predict the changes of the separation point and size as shown in the DNS results. Although, quantitatively, the separation size seems to be smaller in the heated-wall case (Fig. 2 (d)) compared with the DNS, the qualitative changes from the quasi-adiabatic- and cooled-wall ones (Fig. 2 (b) and (f)) are accurately reproduced.
Figure 3 shows the streamwise distributions of skin friction and wall heat flux. Compared with the DNS, the wall-modeled LES slightly overpredicts the skin friction (Fig. 3 (a)) and predicts the flow separation at more downstream location. These discrepancies become more prominent as the wall temperature increases. Also, the wall-modeled LES shows only one peek at (x-x_sh)/d0=-1 regardless of the wall temperature, whereas the DNS results have another peak at upstream locations. In Fig. 3 (b), the wall-modeled LES predicts the decreases of the wall heat fluxes at the separated regions in the heated- and cooled-wall cases, although the heat fluxes increase in the DNS results. These results suggest that although the present wall modeled LES roughly predicts the effects of the heat fluxes on the flow separation, further improvement is desirable for accurate predictions of the separation location and the heat fluxes in the separated region. Since the cause of those discrepancies may be related to the equilibrium assumption used in the wall model, we plan to analyze the interaction between the non-equilibrium effects (e.g., the pressure gradient or the flow separation) and the wall heat fluxes for further improvement of the wall model.
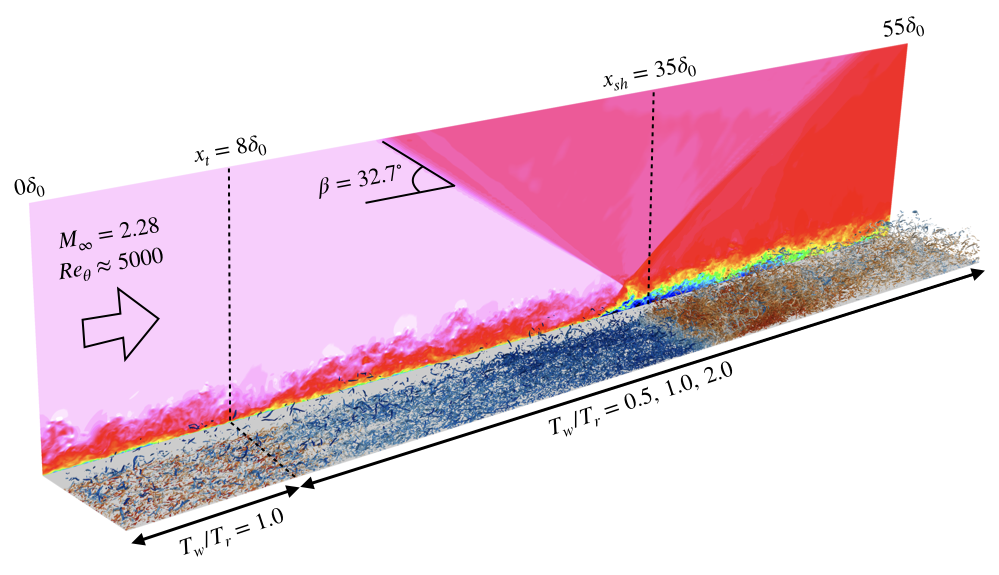
Fig.1: Numerical settings of shock wave/turbulent boundary layer interactions with wall heat flux. Streamwise velocity contours in side plane, and isosurface of Q-criterion colored by temperature in wall-parallel plane.
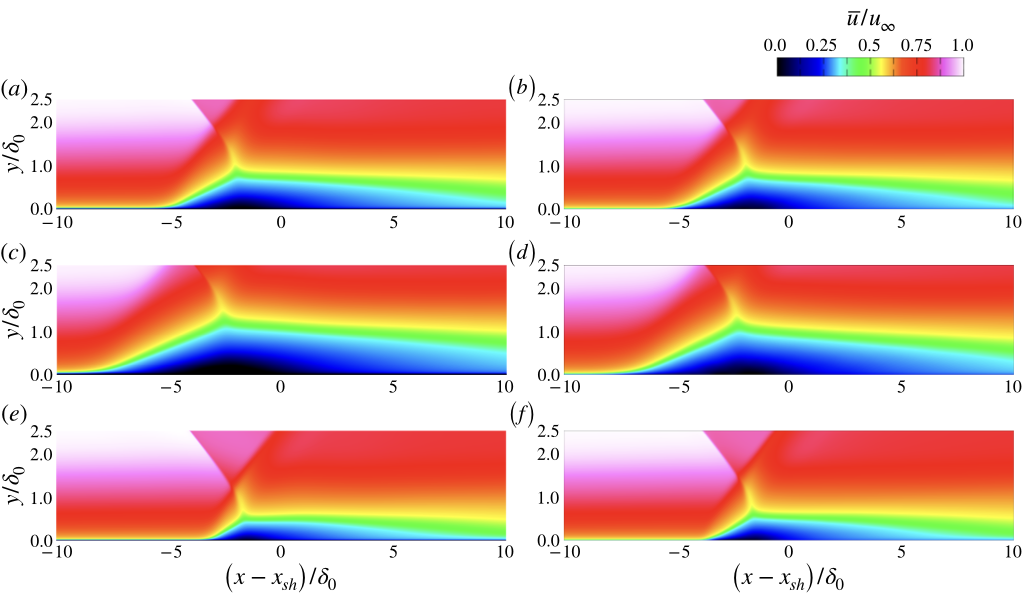
Fig.2: Distributions of mean streamwise velocity. Left column, DNS; right column, wall-modeled LES. (a), (b) quasi-adiabatic-wall condition; (c), (d) heated-wall condition; (e), (f) cooled-wall condition.
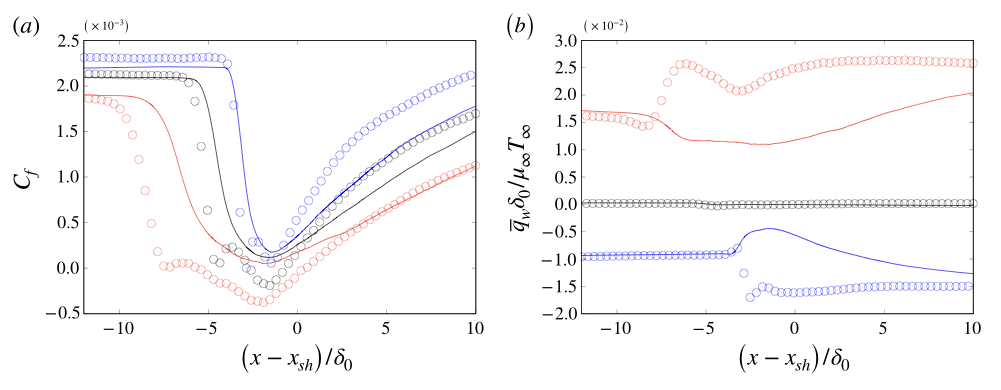
Fig.3: Streamwise distributions of (a) skin friction and (b) wall heat flux. Solid lines, wall-modeled LES; Symbol, DNS. Black, quasi-adiabatic-wall condition; red, heated-wall condition; blue, cooled-wall condition.
Publications
- Peer-reviewed papers
R. Hirai, R. Pecnik, and S. Kawai, "Effects of the semi-local Reynolds number in scaling turbulent statistics for wall heated/cooled supersonic turbulent boundary layers", Physical Review Fluids 6 (12), 124603, 2021.
https://doi.org/10.1103/PhysRevFluids.6.124603
- Oral Presentations
1) R. Hirai and S. Kawai, "DNS of shock-wave and turbulent boundary layer interactions with wall heat flux", 53th FDC/39th ANSS.
2) R. Hirai and S. Kawai, "DNS analysis of wall heat flux effects on shock wave and turbulent boundary layer interactions", AIAA Scitech Forum 2022.
Usage of JSS
Computational Information
- Process Parallelization Methods: MPI
- Thread Parallelization Methods: OpenMP
- Number of Processes: 320 - 432
- Elapsed Time per Case: 120 Hour(s)
JSS3 Resources Used
Fraction of Usage in Total Resources*1(%): 0.01
Details
Please refer to System Configuration of JSS3 for the system configuration and major specifications of JSS3.
| System Name | CPU Resources Used(Core x Hours) | Fraction of Usage*2(%) |
|---|---|---|
| TOKI-SORA | 186868.08 | 0.01 |
| TOKI-ST | 0.00 | 0.00 |
| TOKI-GP | 0.00 | 0.00 |
| TOKI-XM | 0.00 | 0.00 |
| TOKI-LM | 0.00 | 0.00 |
| TOKI-TST | 0.00 | 0.00 |
| TOKI-TGP | 0.00 | 0.00 |
| TOKI-TLM | 0.00 | 0.00 |
| File System Name | Storage Assigned(GiB) | Fraction of Usage*2(%) |
|---|---|---|
| /home | 341.11 | 0.34 |
| /data and /data2 | 10651.11 | 0.11 |
| /ssd | 511.11 | 0.13 |
| Archiver Name | Storage Used(TiB) | Fraction of Usage*2(%) |
|---|---|---|
| J-SPACE | 0.00 | 0.00 |
*1: Fraction of Usage in Total Resources: Weighted average of three resource types (Computing, File System, and Archiver).
*2: Fraction of Usage:Percentage of usage relative to each resource used in one year.
ISV Software Licenses Used
| ISV Software Licenses Used(Hours) | Fraction of Usage*2(%) | |
|---|---|---|
| ISV Software Licenses(Total) | 0.00 | 0.00 |
*2: Fraction of Usage:Percentage of usage relative to each resource used in one year.
JAXA Supercomputer System Annual Report February 2021-January 2022