
Retrieval of greenhouse gas concentrations from GOSAT-2 observations
JAXA Supercomputer System Annual Report April 2020-March 2021
Report Number: R20ER3501
Subject Category: Space Technology
- Responsible Representative: KUZE Akihiko, GOSAT-2 Project Team, Space Technology Directorate I
- Contact Information: Nobuhiro Kikuchi (Earth Observation Research Center)(kikuchi.nobuhiro@jaxa.jp)
- Members: Kenji Kowata, Takehito Yoshida, Fumie Kataoka, Makiko Hashimoto, Shin Ishida, Tomoo Yamasaki, Hideyuki Noguchi, Nobuhiro Kikuchi, Hiroshi Suto
Abstract
Atmospheric concentrations of carbon dioxide, methane and carbon monoxide are retrieved from hyper sectral data measured by The Greenhouse Gases Observing Sattelite 2 (GOSAT-2). Develepment, validation and imprivement of the retrieva algorithm are also carried out.
Reference URL
N/A
Reasons and benefits of using JAXA Supercomputer System
The JAXA supercomputer system is used to retrieved greenhouse gas concentrations from measurement data of the GOSAT-2 satellite. About 100 hours of CPU time is needed to process 1day mesurement data. It takes about 1 hour to process 1 day measurement data, using 10 nodes of the PrePost system computers with 12 cores.
Achievements of the Year
We are developing the JAXA/EORC research algorithm (Level 2 algorithm) which derives from the Level 1 data the atmospheric concentrations of carbon dioxide, methane and carbon monoxide. GOSAT-2 has two advantages. One is the polarimetric measurement of the reflected sunlight in the shortwave infrared (SWIR). The other is that GOSAT-2 measures the thermal emission spectra from the atmosphere in the thermal infrared (TIR) at exactly the same footprint with the SWIR.
The goal of our level 2 algorithm is to retrieve vertical profiles of carbon dioxide and methane concentrations in the troposphere with up to 2 layers by using the SWIR and TIR measurements in combination, and thereby to improve the accuracy of the estimates of greenhouse gas emission. In this year, we retrieved gas concentrations from February 2019 to March 2020, using a new version of the level 1 data which have been improved in the calibration of the TIR spectra.
Figure 1 (left) shows the monthly mean of the column averaged concentrations of carbon dioxide in March 2019. On the other hand, Figure 1 (right) shows the monthly mean of the lower-tropospheric concentrations of carbon dioxide. Because carbon dioxide is a long-lived species, the carbon dioxide concentrations make only a small contrast between its source and surrounding area. However, we can see from Figure 1 (right) an enhanced contrast of the carbon dioxide concentrations in the lower troposphere.
Similarly, Figure 2 shows the monthly mean of the column averaged concentrations of methane (left) and of the lower-tropospheric concentrations (right). As in carbon dioxide, we can see the enhanced contrast of the lower-tropospheric concentration. However, we can see the unrealistic low concentrations in the ocean of the Southern Hemisphere, indicating that the algorithm needs to be further improved.
Figure 3 shows the monthly mean of the column averaged concentrations of carbon monoxide. Note that the vertical profiles of carbon monoxide cannot be retrieved from GOSAT-2 observations. Figure 3 (right) shows the monthly average in January 2020, from which we can see a high density region of carbon monoxide emitted from the bushfires in Australia.
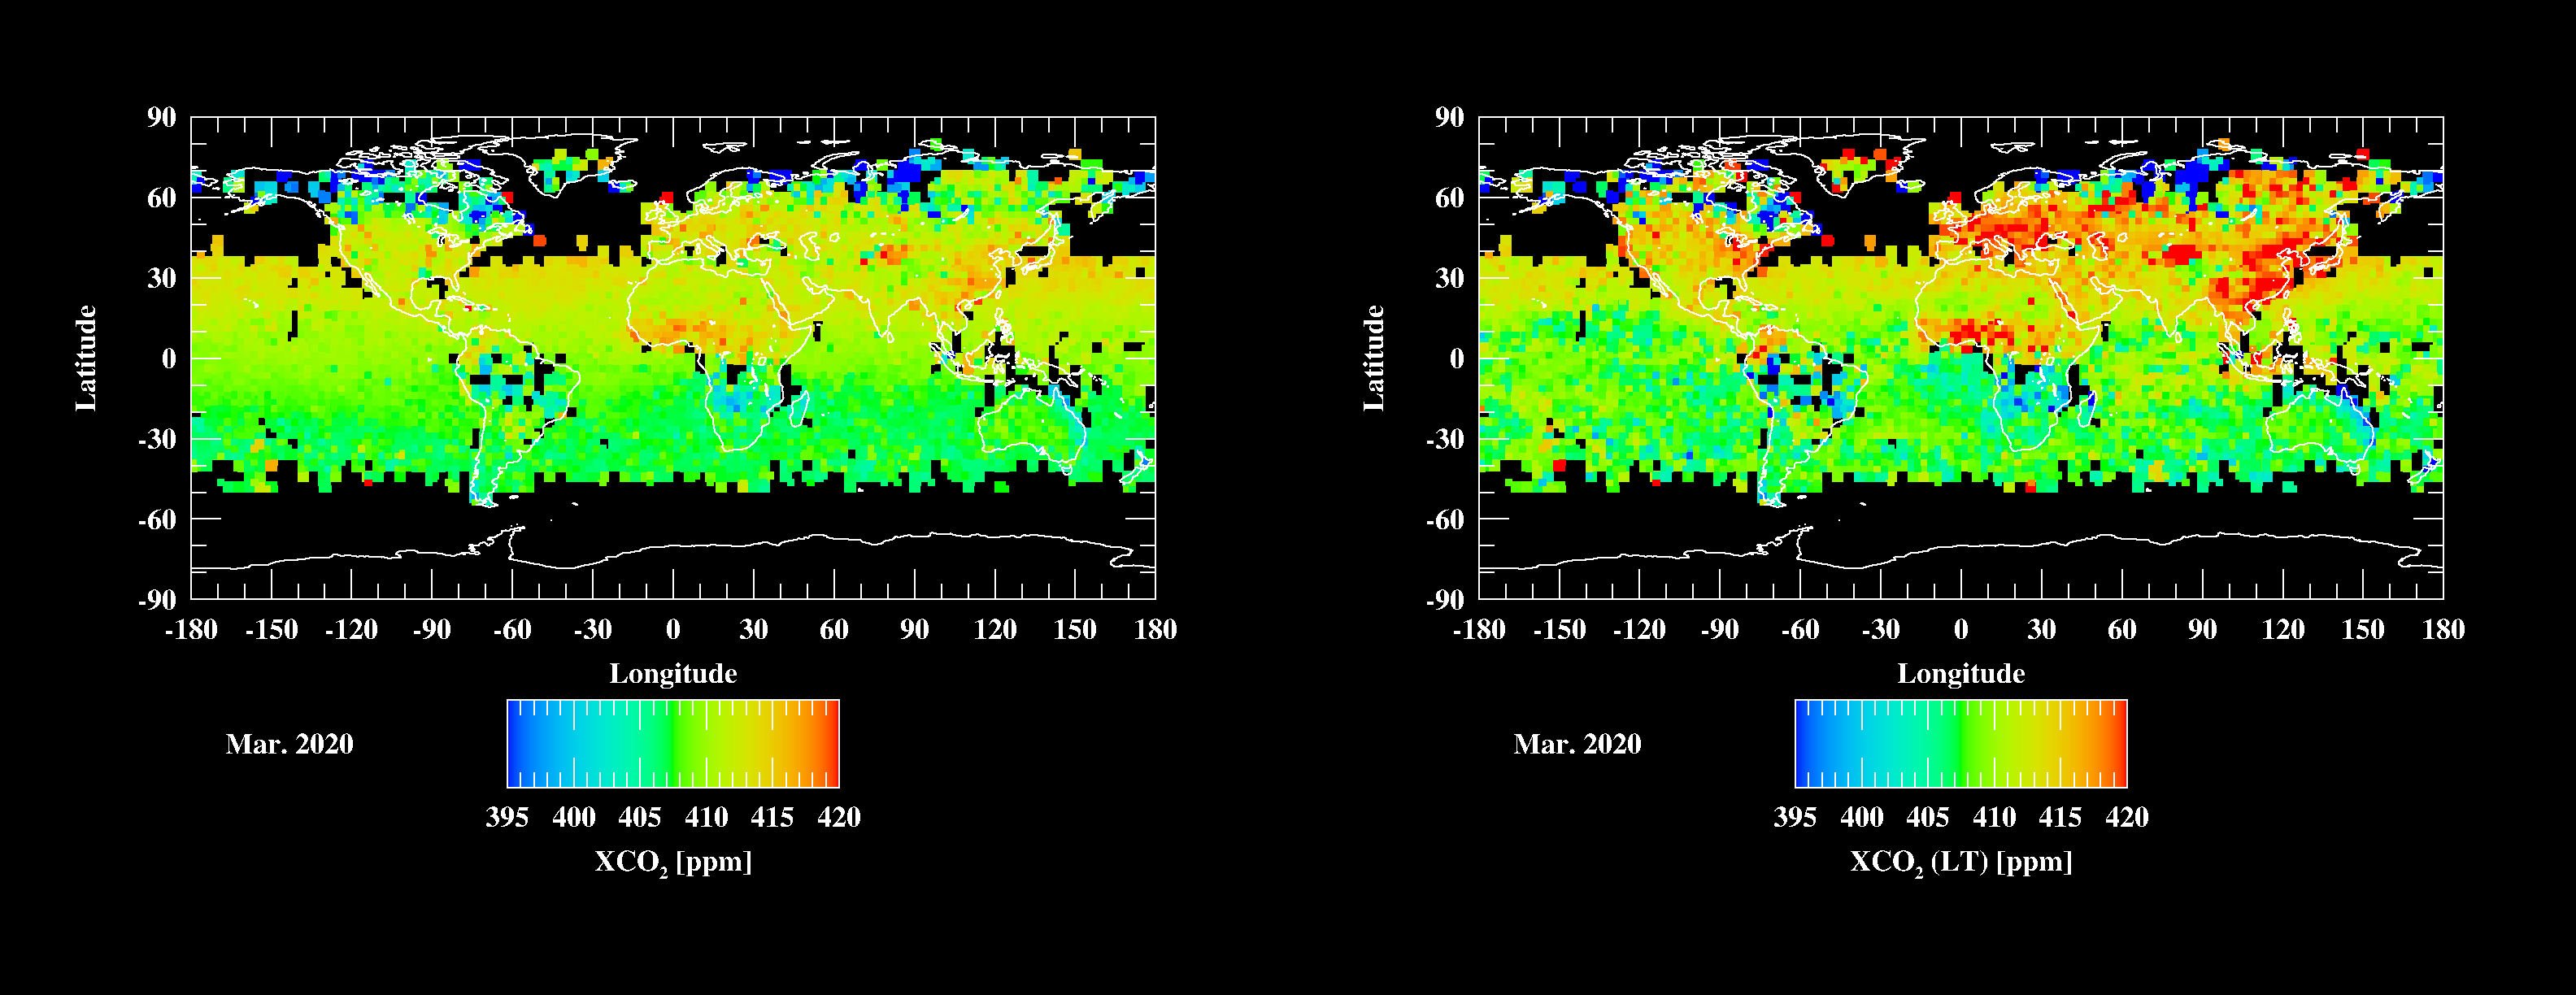
Fig.1: (left) Monthly mean of the column averaged concentrations of carbon dioxide in March 2020 retrieved from GOSAT-2 observations. (right) Similar to left, but for the lower tropospheric concentrations of carbon dioxide.
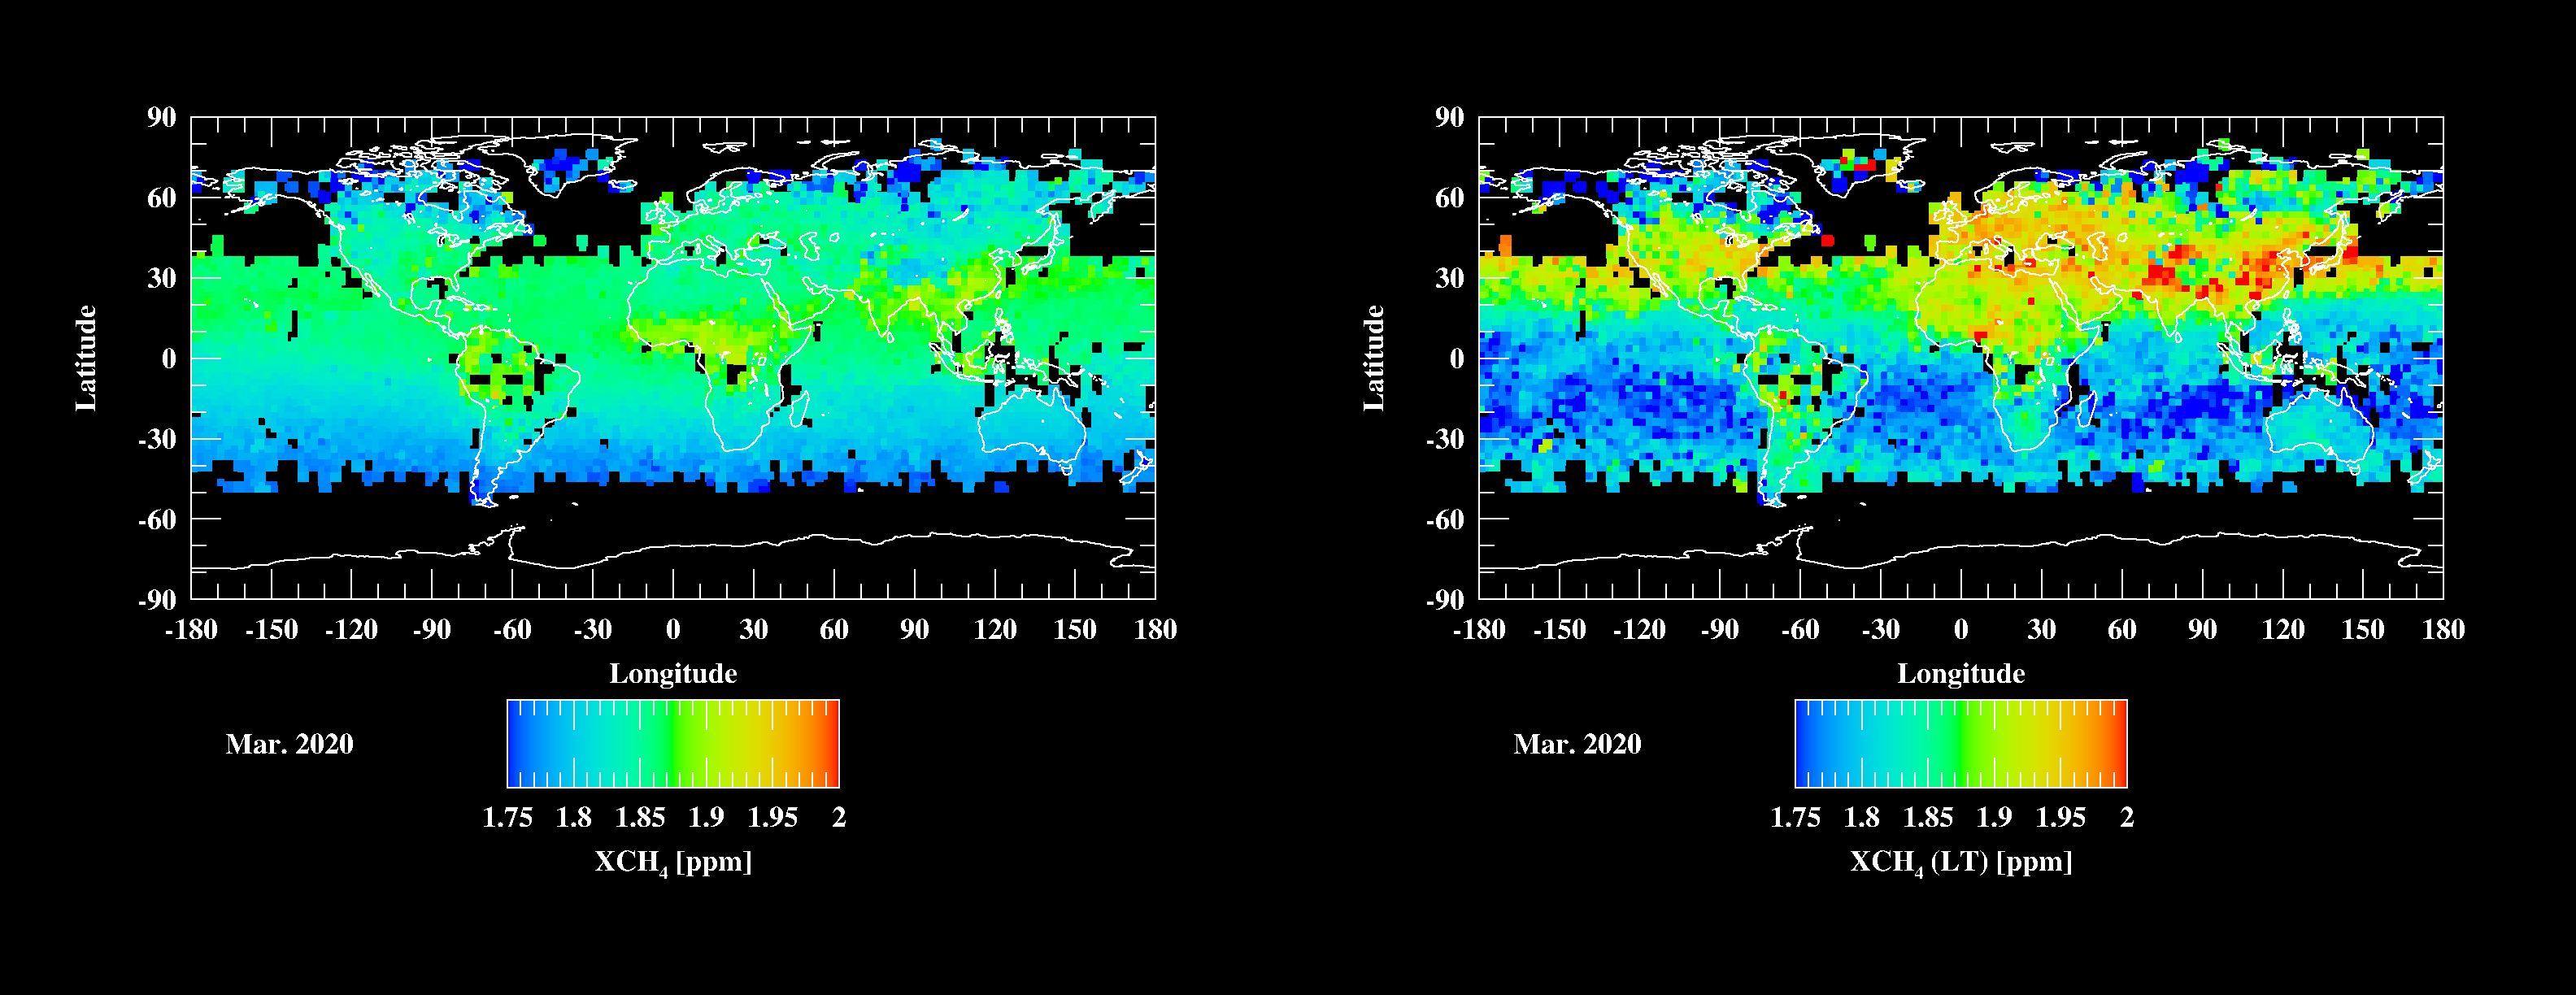
Fig.2: (left) Monthly mean of the column averaged concentrations of methane in March 2020 retrieved from GOSAT-2 observations. (right) Similar to left, but for the lower tropospheric concentrations of methane.
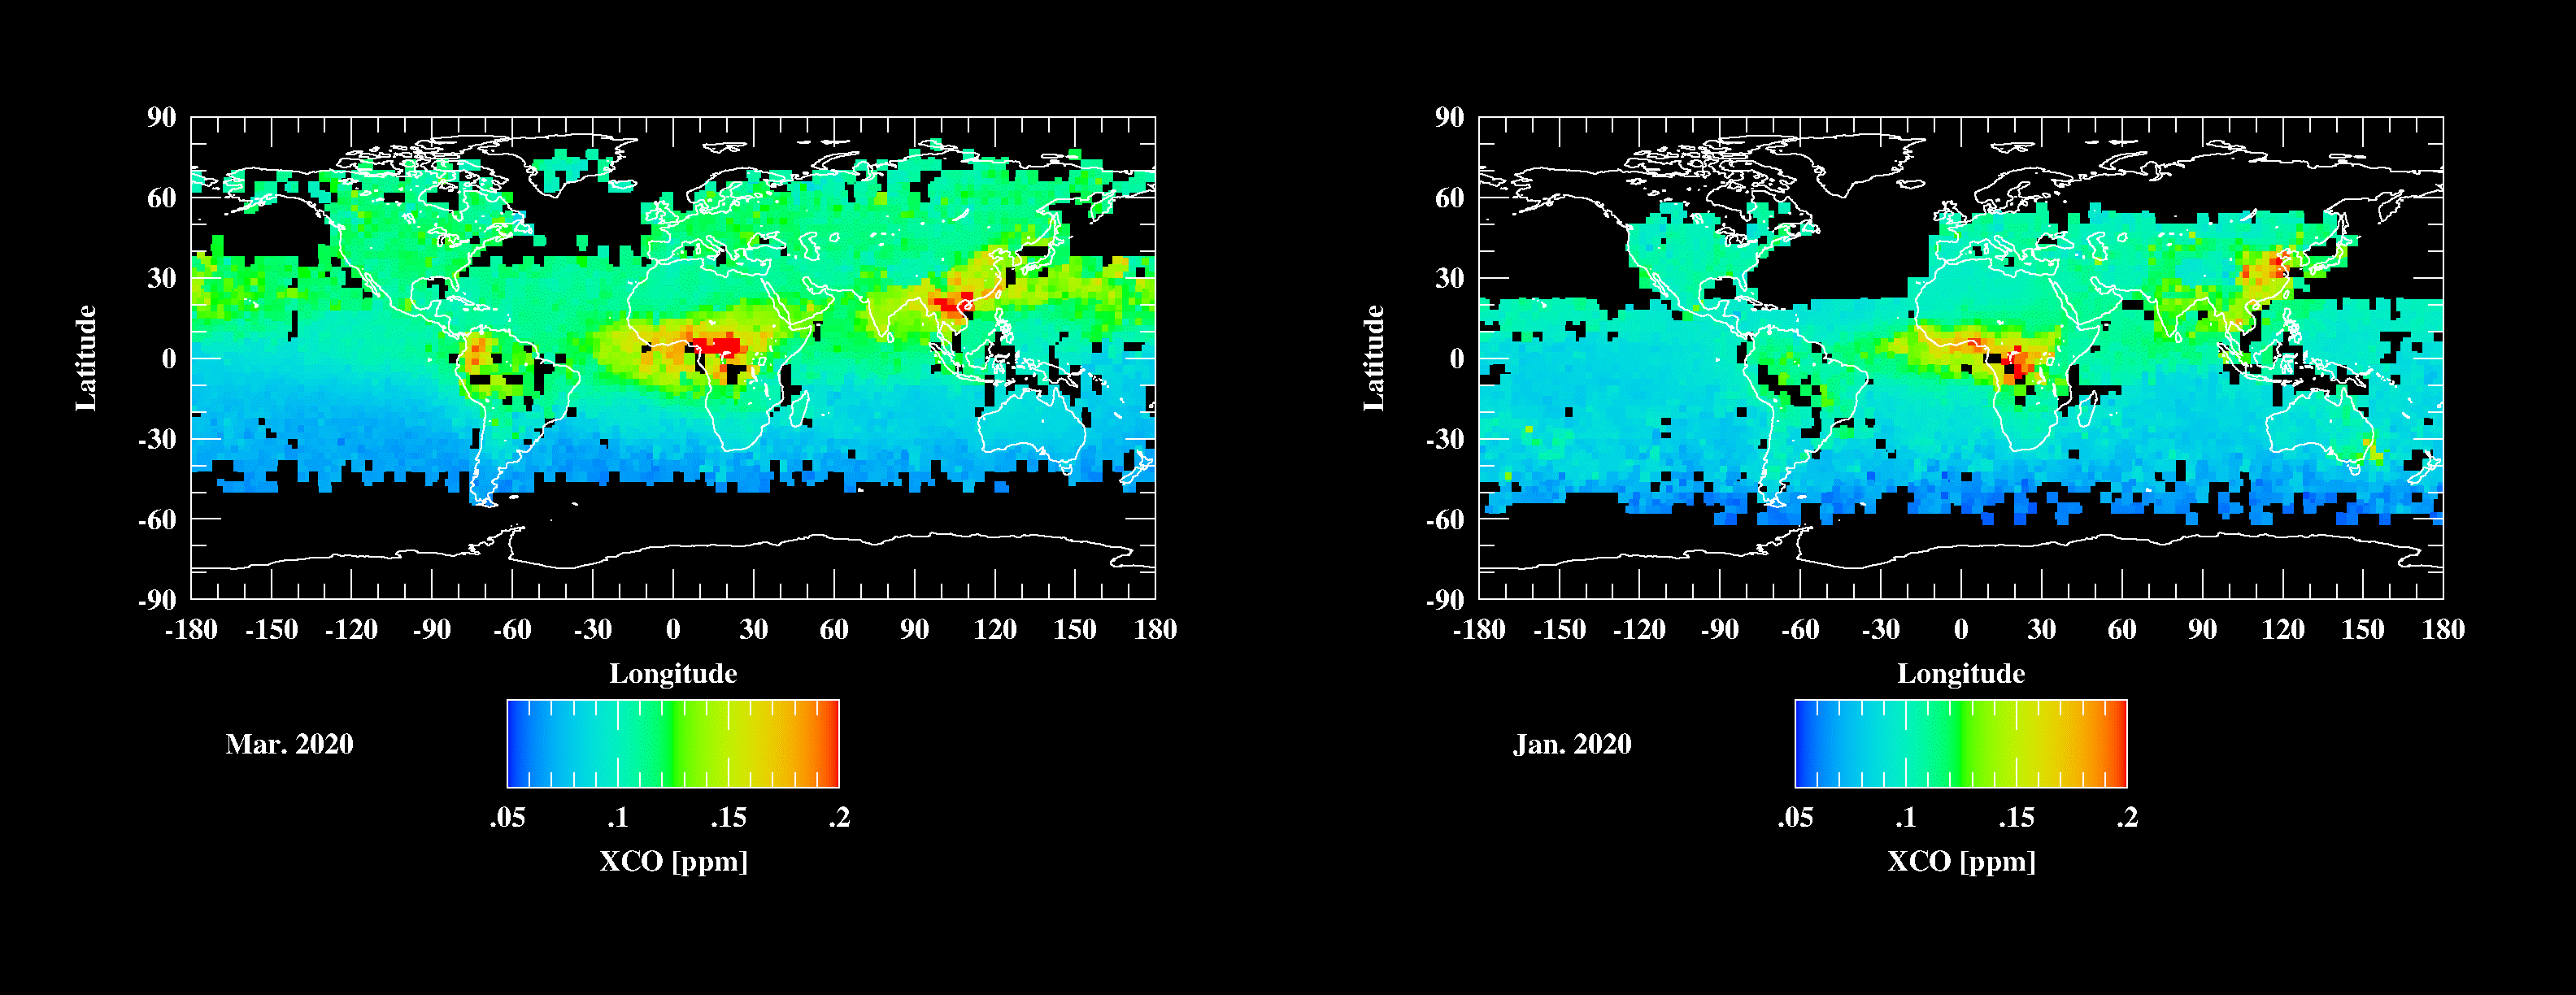
Fig.3: (left) Monthly mean of the column averaged concentrations of carbon monoxide in March 2020 retrieved from GOSAT-2 observations. (right) Same as left, but for in January 2020, where a high density carbon monoxide emitted from bushfires in Australia was detected.
Publications
N/A
Usage of JSS
Computational Information
- Process Parallelization Methods: N/A
- Thread Parallelization Methods: OpenMP
- Number of Processes: 1
- Elapsed Time per Case: 10 Hour(s)
Resources Used(JSS2)
Fraction of Usage in Total Resources*1(%): 0.11
Details
Please refer to System Configuration of JSS2 for the system configuration and major specifications of JSS2.
| System Name | Amount of Core Time(core x hours) | Fraction of Usage*2(%) |
|---|---|---|
| SORA-MA | 0.00 | 0.00 |
| SORA-PP | 142,887.54 | 1.12 |
| SORA-LM | 0.00 | 0.00 |
| SORA-TPP | 0.00 | 0.00 |
| File System Name | Storage Assigned(GiB) | Fraction of Usage*2(%) |
|---|---|---|
| /home | 36.97 | 0.03 |
| /data | 49,567.47 | 0.96 |
| /ltmp | 7,570.69 | 0.64 |
| Archiver Name | Storage Used(TiB) | Fraction of Usage*2(%) |
|---|---|---|
| J-SPACE | 0.00 | 0.00 |
*1: Fraction of Usage in Total Resources: Weighted average of three resource types (Computing, File System, and Archiver).
*2: Fraction of Usage:Percentage of usage relative to each resource used in one year.
Resources Used(JSS3)
Fraction of Usage in Total Resources*1(%): 0.09
Details
Please refer to System Configuration of JSS3 for the system configuration and major specifications of JSS3.
| System Name | Amount of Core Time(core x hours) | Fraction of Usage*2(%) |
|---|---|---|
| TOKI-SORA | 0.03 | 0.00 |
| TOKI-RURI | 34,634.52 | 0.20 |
| TOKI-TRURI | 0.00 | 0.00 |
| File System Name | Storage Assigned(GiB) | Fraction of Usage*2(%) |
|---|---|---|
| /home | 27.43 | 0.02 |
| /data | 97,930.59 | 1.64 |
| /ssd | 274.30 | 0.14 |
| Archiver Name | Storage Used(TiB) | Fraction of Usage*2(%) |
|---|---|---|
| J-SPACE | 0.00 | 0.00 |
*1: Fraction of Usage in Total Resources: Weighted average of three resource types (Computing, File System, and Archiver).
*2: Fraction of Usage:Percentage of usage relative to each resource used in one year.
JAXA Supercomputer System Annual Report April 2020-March 2021